Cross-platform reach · 24 min read · Interactive · Video
How many real people did I actually reach across platforms? Capture-recapture, the Petersen-Lincoln estimator
It is the first Monday of the month, and the campaign recap is due by lunch. The same campaign ran on Meta and on TikTok (synthetic, built so the right answer is known in advance). Meta's report says 714,202 people saw the ads. TikTok's says 481,237. Somebody adds them up and writes 1,195,439 on the slide, under the heading people reached. It looks generous. It is.
The short answer
Fewer people than your two reports add up to, and no report can tell you exactly how many fewer. Adding Meta's reach to TikTok's counts everyone who saw both campaigns twice, and neither platform can see the other's audience to take them out. Your own website can, for the people who click. From the visitors who arrived from both you can bracket the real reach: a lowest figure from the fish-counting method ecologists call capture-recapture (the Petersen-Lincoln estimator, as Chao, Pan and Chiang set it out), and a highest figure from the overlap two random audiences would share. Tested on several hundred synthetic markets, adding the reports overstated reach by about a quarter on a typical market, and the true figure sat inside the bracket 96 times out of 100 when the population was known, and 75 times when it was guessed within a factor of two.
The method cannot give you a single number. Only a panel that watches the same people on both platforms can.
The sum counts some people twice
In this market, 196,986 people saw both campaigns. The sum counts each of them twice, so the real number of people reached is 998,453.
Neither platform could have told you that. Meta knows its own audience and nothing about TikTok's, and TikTok knows the reverse. The same person, scrolling both apps on one phone, is one person to each platform and two to the sum.
Your website is the one place the overlap shows. That month, 34,312 different people arrived from the two campaigns, and 335 of them came from both.
TikTok brought 11,944 visitors Meta had not. Those counts are exact, because the site recognised each returning visitor itself.
Work the visitors backwards and you get the lowest the reach can be, which comes out at 776,226 here, about a fifth below the truth. Assume the two audiences overlap only by chance and you get the highest it can be: 1,052,230.
The truth sits between the two, and nothing in either report says where. So the honest answer for the person with the slide has three parts: an exact count of visitors and customers, a range for the reach, and a polite refusal to name one total. From here on I call the platforms A and B, A being the one with the bigger reach.
What this answers, and what it lets you decide
The method answers one question: how many different people two platforms reached together, and how many of them the second platform added. That is a question about exposure, for deciding whether a platform finds new eyes and what a new pair of eyes costs. It takes each platform's reported reach and your site's visitors by platform, and gives back exact counts for what the site can see, a lowest and a highest figure for the total reach, and a refusal to name the total itself.
It is not attribution, which hands out credit for a customer, and not incrementality, which asks what the ads caused. Nor is it a cost per acquisition method. The cost of a new customer is a count your site already has, and it needs no overlap at all.
What it lets you decide is whether the second platform is worth keeping for the new people it reaches. The price of an extra person reached is B's spend divided by the people it reached that A had not. On the worked market that price lies between 7.1 and 38.7 cents, a range because the overlap is one.
If both ends are a price you would pay for awareness, keep the platform. If neither is, cut it. When your line falls between them, as it does here, the reports cannot show that the two platforms reach the same people, so do not cut on that claim. Measure what the platform adds with a holdout test instead, which is also the only thing that says whether its customers would have bought anyway.
Which methods this uses, and why not the others
Three things run, each honest in its own way. The first is an exact count: your site's visitors, de-duplicated across the platforms, with how many each platform brought that the other had not and, from the site's own records, how many became customers.
The second is the lowest the reach can be, from the fish-counting trick explained below, with the visitors from both platforms as the fish caught twice. It is exact when everyone reached is equally likely to click, and a floor when the people on both platforms click at least as readily as the rest. That is the usual case, and I state it below as the condition it is, not as a law.
The third is the highest the reach can be: the overlap two random audiences drawn from one population would share. The range from floor to ceiling is the answer. A single number inside it would be a guess, and the method refuses to make one.
Four other approaches answer the same question, or one that looks like it.
Adding the two reach numbers. It needs nothing, and it is an honest ceiling, because the real reach can never be larger. The trouble is that it overstates by the whole overlap: a fifth on the worked market, a quarter on a typical market in my scoring. Most dashboards do it without saying so.
The chance formula on its own. Multiply the two reaches and divide by the population both draw from. It is instant, and with the right population it is a tighter ceiling than the sum. Real audiences overlap more than chance, though, because the people who are online a lot are online everywhere. And nobody reports the population it divides by, so a guess off by a factor of two either way makes it a coin toss.
The platforms' own de-duplicated reach, or an industry panel. Each platform de-duplicates within its own walls, with models calibrated on panels, census figures and surveys [7, 8]. That is the right instrument, because a panel sees the same people's ad views wherever they happen. But each model stops at its own platform's boundary, so Meta and TikTok are still two numbers. A panel that spans publishers exists in some markets (the UK's Origin is one [5]), and it is a subscription for large advertisers, not a report on a media buyer's desk.
A geo holdout. This answers a different question that gets mistaken for this one. Reach says who saw the ad, and a holdout says what the ad did. If the decision is whether TikTok adds sales, the holdout is the instrument. If it is whether TikTok reaches new people, and at what price, the overlap is the whole question and a holdout cannot see it.
The question underneath
A click lands on your site with the platform's tag in the address, and the site's cookie recognises the same visitor when they come back from the other platform. So for its own visitors, the site knows exactly which platforms each one came from.
That slice is small, because only a few in every hundred people reached ever click. It is also not random. The people reached on both platforms are keener on average, and the keenest of them click both ads.
Picture the visitors from Meta as marked fish returned to a lake, and the visitors from TikTok as a second catch. The share of the second catch that is marked tells you how big the lake is, and the two-platform version tells you how many people are on both platforms. It works if every fish is equally easy to catch. It fails, in one known direction, if some fish are what ecologists call trap-happy. They turn up in both catches more than their numbers warrant, and here the overlap looks bigger than it is. That direction is the whole story of the click-based figure.
The formula, written out
Here is the maths. The exact part takes one line and the estimate one more. The rest explains why its error runs one way.
The exact part. With vA visitors from platform A, vB from B and vAB from both, the distinct visitors are
vA + vB − vAB
and the visitors B brought that A had not are vB − vAB. These are counts, with no model in them.
The click-based overlap. Let RA and RB be the reported reaches. If every person reached had the same chance of clicking each ad, the visitors from both would be the people on both times both click rates. Turn that round and you have the overlap:
Ô = RB · (vAB ÷ vB) · (RA ÷ vA) = vAB · RA · RB ÷ (vA · vB)
- vAB ÷ vB is the share of B's visitors who also came from A, 2.7 per cent on the worked market.
- RA ÷ vA is one over A's click rate, about 32 here, because only 3.1 per cent of the people A reached ever visited. It turns also visited from A into also reached by A.
- Together they give the share of B's audience also reached by A, 87 per cent by this formula.
The unique reach is RA + RB − Ô, and the people B added that A had not reached are RB − Ô.
The middle factor is where the trouble lives. It multiplies the shared visitors about thirty-fold, so every visitor from both platforms stands for about thirty people on both. If the visitors from both platforms come out twice what even keenness would give, the formula credits A with twice the share of B's audience it deserves. Here it says 87 per cent of B's audience was also reached by A, and the truth is 41 per cent.
Why it errs one way. Statisticians know this scaling as the Petersen-Lincoln estimator, and the paper I lean on states its one condition plainly: "the estimator is not valid when the capture sample and recapture sample are not independent" [1]. Two things break that independence, and the data cannot tell them apart [1]. One is people on both platforms clicking more than people on one. The other is a person's two clicks being linked through who they are. Either way the shared count comes out inflated, and the error grows with the strength of the link [1].
So the overlap comes out too big, and the reach too small, by one plus a dependence measure, times two keenness factors: how much more readily the people on both platforms click each ad than that platform's average reached person. The generator knows every person's click chance, so all three can be measured.
| ingredient, worked market | value |
|---|---|
| the dependence measure | 0.57 |
| keenness factor of the people on both, for A's ad | 1.22 |
| keenness factor of the people on both, for B's ad | 1.17 |
Their product predicts an overlap 2.23 times the truth, and the notebook measured 2.13.
The figure is a floor when that product is at least one: when the people on both platforms click at least as readily as each platform's average, and their two clicks rise and fall together, as the paper shows they must when one trait drives both [1]. That is a statement about a market, not a law. Every market in my scoring meets it by construction, so the scoring cannot test it (noise alone still put the floor above the truth on about one market in twenty-five), and a market whose double-reached people click less than the rest would put the truth below the floor.
The chance ceiling. If the two audiences were random slices of a population of P people, the expected overlap would be
Ochance = RA · RB ÷ P
and the unique reach RA + RB − Ochance. Audiences that overlap more than chance make this overlap too small and the reach too big, which makes it a ceiling, given P.
The sampling interval. Each visitor count carries a relative variance of about one over itself, and the overlap's error on the log scale adds the three up: √(1/vAB + 1/vA + 1/vB), times 1.96 for a ninety-five per cent interval. The smallest count, always the visitors from both, dominates. This interval measures noise. It says nothing about the keenness bias.
The refusal. With two platforms the reports hold three usable numbers, and the truth needs four [1]. The fourth is the keenness, and no amount of data from the same two platforms supplies it. The literature's answer is to estimate only the people with a real chance of being observed [3]. My version of that retreat is the range.
The worked example synthetic
Every number here comes from the accompanying notebook, which builds the market with its answer known (synthetic throughout).
The market. One consumer brand, one month, one campaign on two platforms. The generator builds a market of 2,400,000 people who share one trait: how much of their life they spend online. People high on it are likelier to be on either platform, so the audiences overlap 1.38 times chance here.
Keenness to click follows the same trait. Of B's audience, 41 per cent was also reached by A, so B added 284,251 people A had not reached.
What the site sees. 22,368 visitors arrived from A and 12,279 from B.
About 1 per cent of those visitors came from both platforms, while nearly 20 per cent of the people reached were on both. The visitor share is the overlap shrunk by two click rates, which is why reading it as the overlap is the report's most common lie.
Those click rates are about 3.1 and 2.6 per cent.
| what the site sees | count |
|---|---|
| visitors from A | 22,368 |
| visitors from B | 12,279 |
| visitors from both | 335 |
| distinct visitors | 34,312 |
| visitors B brought that A had not | 11,944 |
| customers who arrived via B and never via A | 341 |
| customers who arrived via both | 9 |
Four readings of the same reports. The sum and the visitor share land far too high, almost on top of each other. The chance formula, given the true population, is a few per cent high. The click-based floor is furthest out, with an overlap more than double the truth, because in this market the visitors from both are 2.1 times what even keenness would produce.
Its sampling interval runs from 727,796 to 819,640, about eleven per cent either way on the overlap. The noise is small next to the bias.
| reading | overlap | unique reach | against the truth |
|---|---|---|---|
| the truth | 196,986 | 998,453 | exact |
| the sum | 0 | 1,195,439 | 19.7 per cent high |
| the visitor share, scaled up | 13,129 | 1,182,310 | 18.4 per cent high |
| the chance formula, true population | 143,208 | 1,052,230 | 5.4 per cent high |
| the click-based floor | 419,213 | 776,226 | 22.3 per cent low |
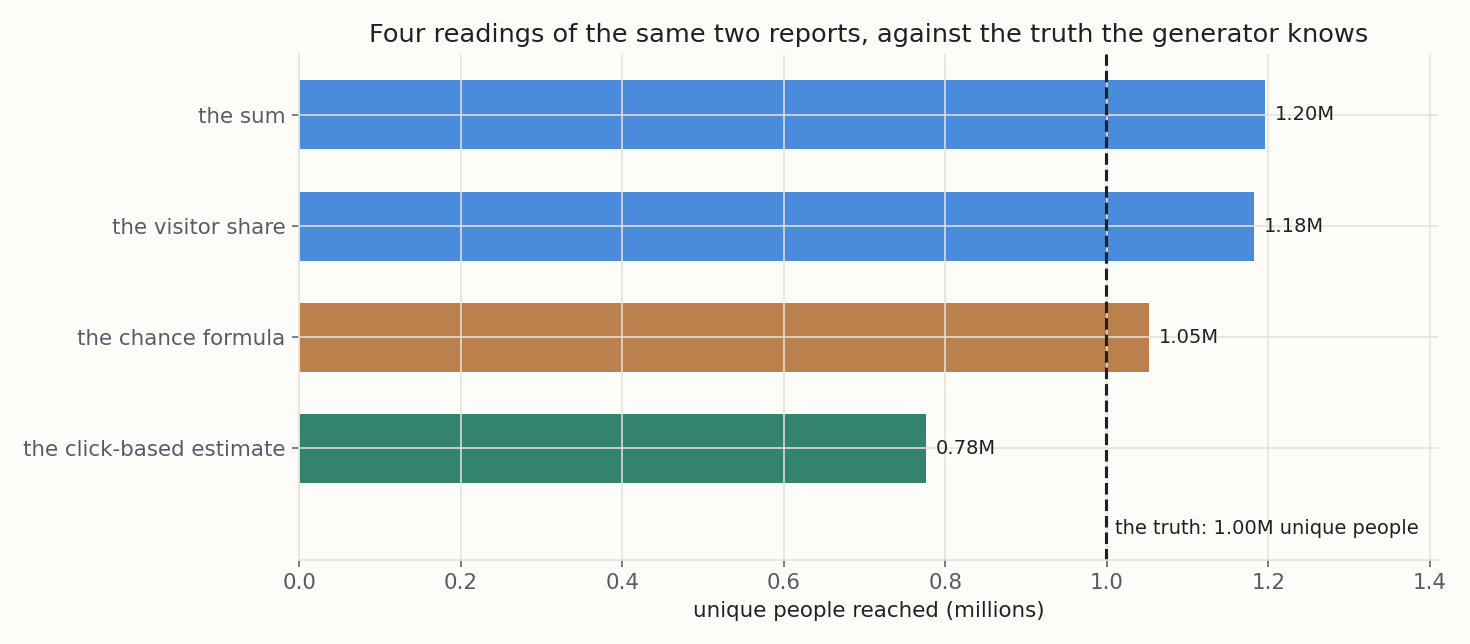
The range. The truth sits between the floor and the ceiling, in a range 27.6 per cent of the true reach wide. Say how much keener your double-reached people are and the floor moves, as the table shows. The data cannot say which row is yours.
| if the visitors from both are | the click-based reach becomes |
|---|---|
| 1.5 times what even keenness gives | 915,964 |
| 2 times what even keenness gives | 985,832 |
| 3 times what even keenness gives | 1,055,701 |
What an extra person reached costs. Platform B cost €24,000 for the month. Priced against the truth, each extra person it reached cost 8.4 cents.
Across the readings the price runs from 7.1 cents on the chance formula to 38.7 on the click-based floor.
The price swings far more than the reach, because the overlap comes off B's reach alone, a number two-fifths the size of the sum. On this market the click data cannot settle whether B is worth keeping for new eyes.
| reading | new people B reached that A had not | price of an extra person reached |
|---|---|---|
| the truth | 284,251 | 8.4 cents |
| the sum | 481,237 | 5.0 cents |
| the chance formula | 338,028 | 7.1 cents |
| the click-based floor | 62,024 | 38.7 cents |
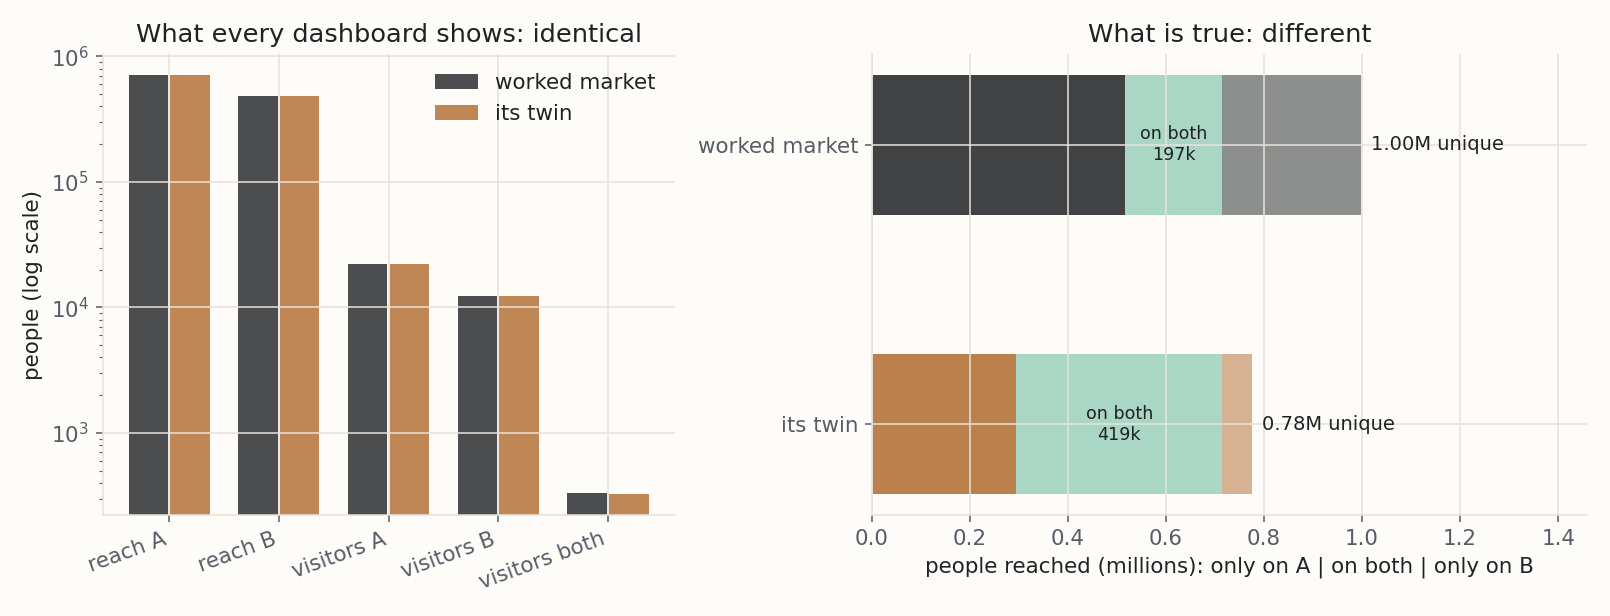
Two markets, one report. Now build a second market around the worked market's reports, with keenness spread evenly, so the click-based formula is exact in it. Every dashboard a marketer can open shows the same numbers for both, give or take a handful of visitors.
Its true unique reach is 776,226, so the worked market reached 29 per cent more people on identical reports.
This is the refusal, built rather than argued. It is the literature's own picture of the problem, too: models that produce "almost identical fitted observed frequencies, while inducing completely different estimates for the number of unobserved individuals" [3].
| the worked market | its twin | |
|---|---|---|
| visitors from A | 22,368 | 22,356 |
| visitors from B | 12,279 | 12,305 |
| visitors from both | 335 | 325 |
| true unique reach | 998,453 | 776,226 |
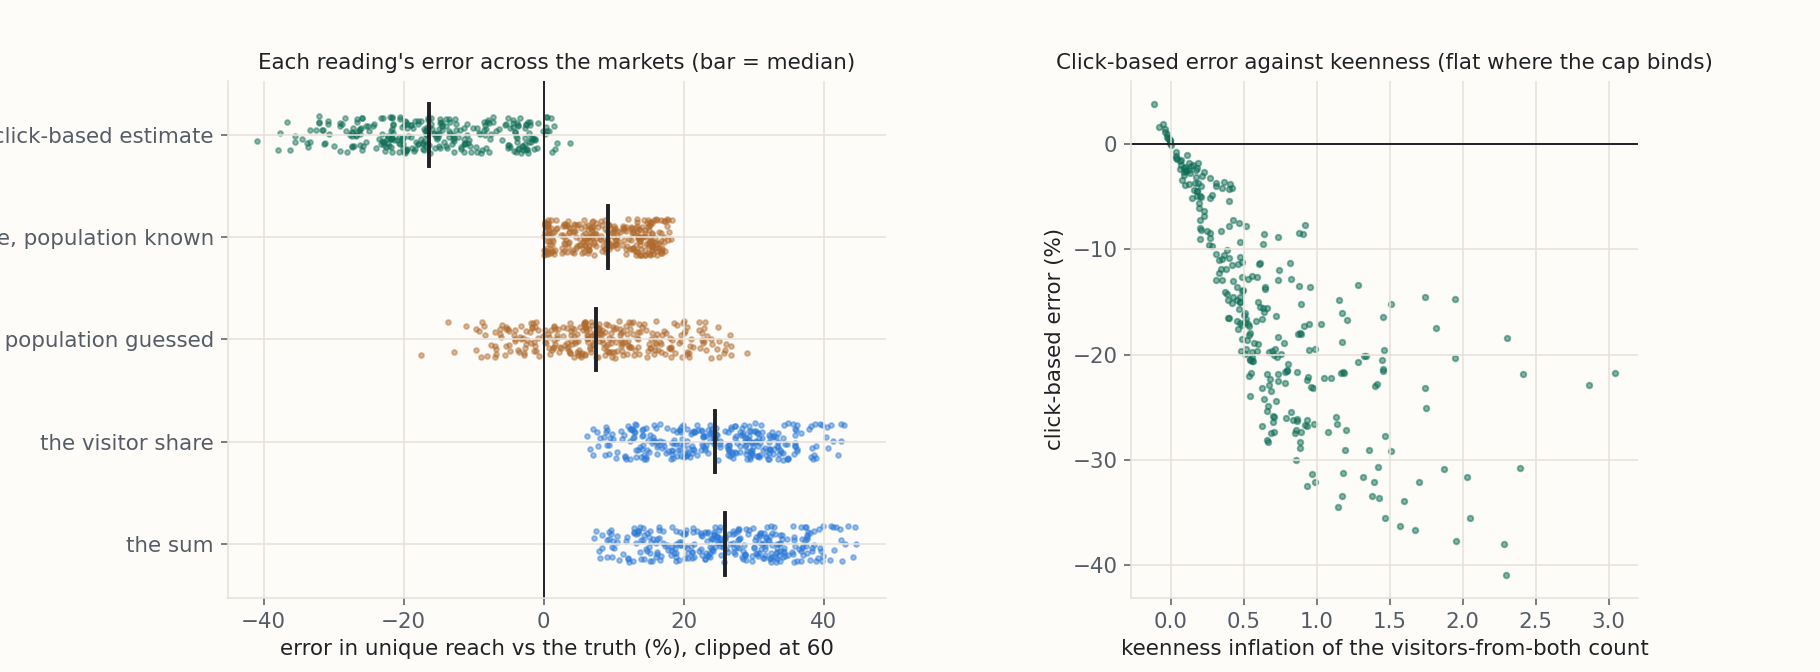
Scored on five hundred markets. One market proves nothing, so the notebook builds five hundred, each with its own size, reach shares, audience overlap, keenness and click rates. The method refused on 41 per cent of them, because the visitors from both fell below its floor of 97.
The table scores the 293 markets it ran on, each reading's error as a share of the true unique reach.
| reading | typical error | worst tenth | within 10 per cent |
|---|---|---|---|
| the sum | +25.9 % | 37.6 % | 5 % of markets |
| the visitor share | +24.4 % | 35.9 % | 6 % |
| the chance formula, population known | +9.2 % | 15.9 % | 54 % |
| the chance formula, population guessed | +7.5 % | 20.7 % | 59 % |
| the click-based estimate | −16.4 % | 28.2 % | 30 % |
| the click-based estimate, stratified by the segment | −13.4 % | 24.1 % | 35 % of the 274 it ran on |
The bigger finding is the bracket. The truth sat between the floor and the ceiling on almost every market, and on every one once the floor's sampling interval was added. On a third of the markets the click-based overlap came out larger than the smaller platform's entire reach, which is impossible, and the floor collapsed to the larger reach.
And the decision? The price of an extra person reached agreed within a factor of one and a half at the two ends of the range on fewer than a quarter of markets. On the rest, the decision needs an instrument the site does not have.
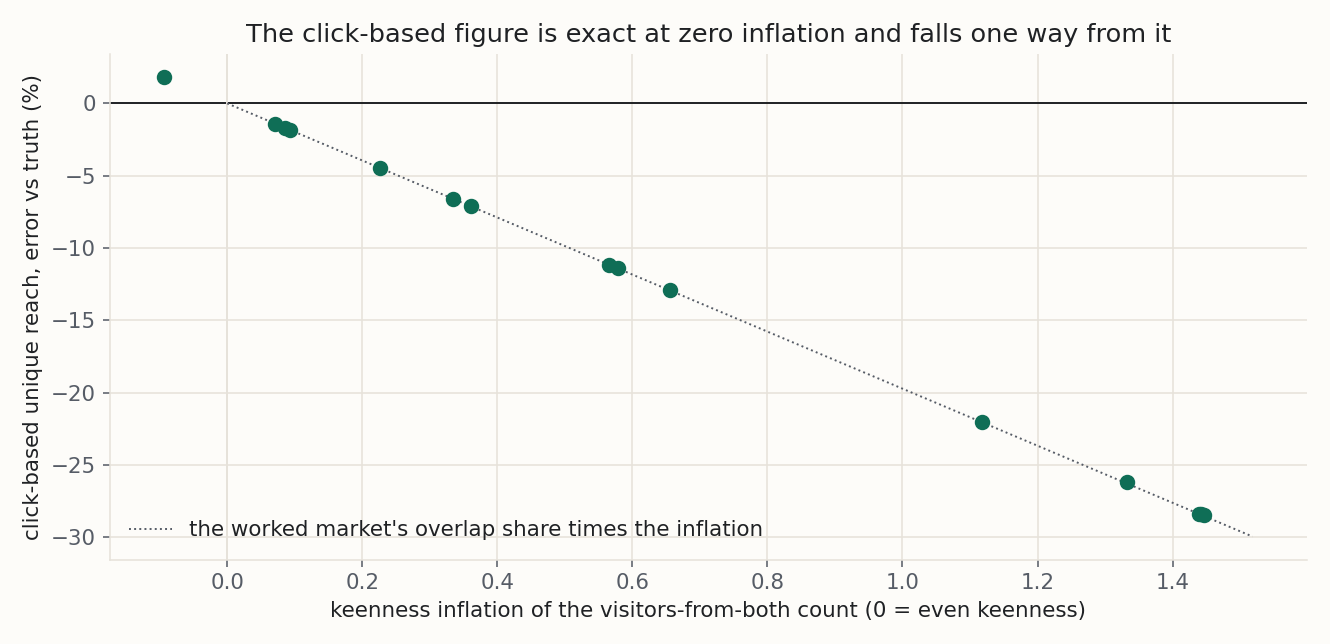
Where keenness was nearly even, the floor was almost exactly right. The formula is right where its condition holds, and the condition is the thing no report checks.
| what else the scoring found | across the scored markets |
|---|---|
| truth inside the range from floor to ceiling | 96 per cent of markets |
| the same, with the population guessed within a factor of two | 75 per cent of markets |
| the same, where the floor did not collapse onto the larger reach | 94 per cent of markets |
| width of the range, typical market | 25.5 per cent of the truth |
| width of the range, worst tenth | 40.6 per cent of the truth |
| click-based overlap larger than the smaller platform's whole reach | 34 per cent of markets |
| audience overlap against chance, typical market | 1.54 times |
| markets overlapping one and a half times chance or more | 162 |
| chance formula's typical error on those | 13.7 per cent high |
| price agreeing within one and a half times at both ends | 23 per cent of markets |
| markets with nearly even keenness | 20 |
| click-based typical error on those | −0.8 per cent |
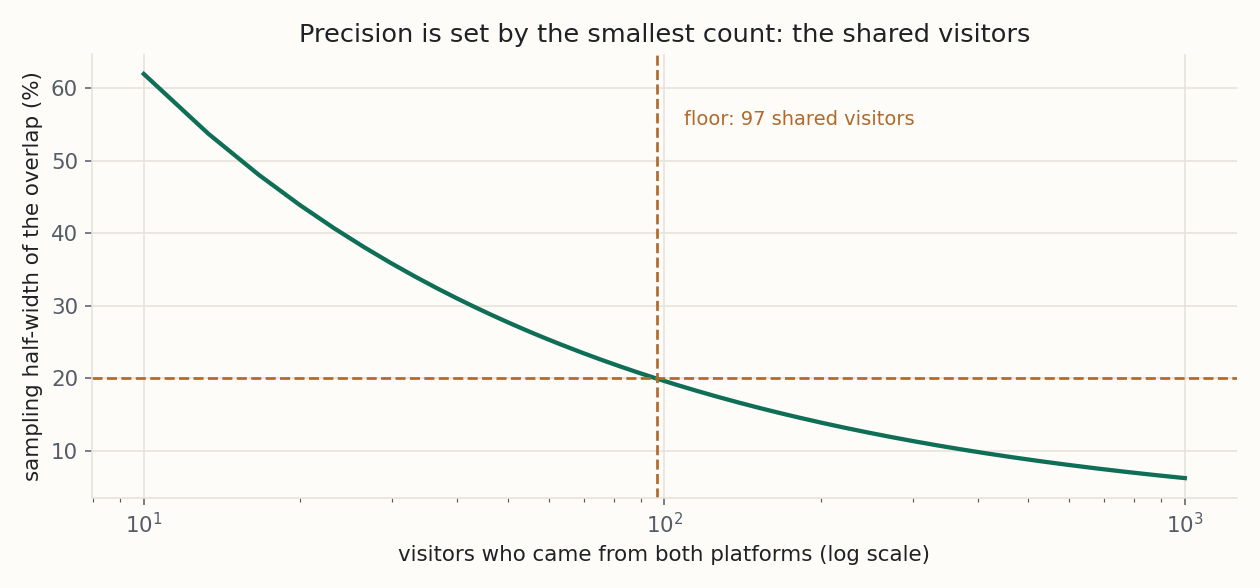
The shared-visitor floor. The click-based figure's precision is set by the visitors from both, and only by them. The notebook refuses below 97, where the sampling half-width crosses 20 per cent.
| visitors from both | sampling half-width |
|---|---|
| 30 | 35.8 per cent |
| 100 | 19.6 per cent |
| 400 | 9.8 per cent |
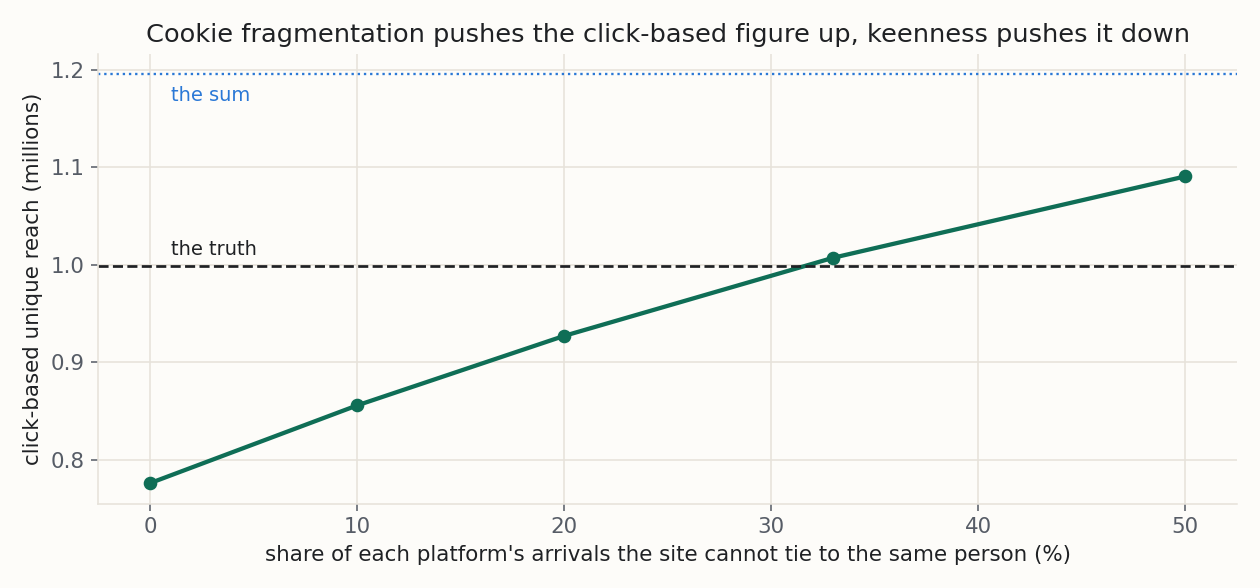
Fragmentation. Everything above assumes the site recognises the same person on both arrivals. A cookie often does not. A click from a social app opens in the app's own browser, a person on two devices is two visitors, and a person split this way never counts as a visitor from both.
If a third of arrivals cannot be tied to the person's other arrival, the shared count more than halves and the click-based reach lands within 1 per cent of the truth. That is an accident: the fragmentation bias and the keenness bias happened to cancel. At half untied the figure overshoots and heads for the sum.
| arrivals the site cannot tie together | visitors from both counted | click-based overlap | click-based reach |
|---|---|---|---|
| none | 335 | 419,213 | 776,226 |
| a third | 150 | 188,185 | 1,007,254 |
| half | 84 | 104,803 | 1,090,636 |
Consent. Where the cookie needs consent, the site sees shared visitors only among people who consented, while each platform's arrivals can still be counted on the server. With the same consent rate on both platforms, dividing the shared count by that rate put the reach back to 2.5 per cent below the full-consent figure, because the shared visitors happened to consent a little more often than the rate. That worked only because consent here was drawn independently of everything else, which nothing you hold can check. With the rates skewed between platforms, the correction leaves a band about as wide as the gap between them.
| consent | shared visitors seen | uncorrected reach against full consent | after dividing by the consent rate |
|---|---|---|---|
| 70 per cent on both platforms | 246 | 14.3 per cent higher | 2.5 per cent lower |
| 75 per cent on one, 65 per cent on the other | 226 | 17.6 per cent higher | a band 7.4 per cent wide |
What narrows the range
More of the same data does not shrink the range, because the keenness bias is a property of who clicks, not of how many. The paper names what does narrow it [1], and one route is cheap.
Split by a segment both sides can see. Part of the link between the two click lists comes from groups you can observe. The paper's example is a population of men and women, independent within each sex and linked once pooled, and its remedy is to analyse each group on its own [1]. Statisticians call this stratifying. Platforms report reach by region, device and age band, and a site sees region and device. Work out the floor within each segment and add them up, and the part of the keenness that differs between segments is gone.
The worked market's segment is the device class (desktop, mobile web, app), which explains about two-fifths of the trait behind the keenness. Split this way, the floor sits 15.6 per cent below the truth, against 22.3 per cent pooled.
The split reach is 842,381, with a combined sampling half-width of 11.8 per cent, under the twenty per cent at which the notebook refuses. It is still a floor, because the keenness left within each segment pulls the same way.
| the split floor across the scored markets | result |
|---|---|
| markets it ran on | 274 |
| refused for a half-width over twenty per cent | 6 per cent |
| closer to the truth than the pooled floor | 89 per cent of them |
| typical error removed | 1.6 per cent of the true reach |
A random second sample. The bias vanishes when the second catch is a random sample of the audience, however selective the first is [1]. Clicks are the opposite. A platform-run survey of a random group of exposed people, asking whether they saw the other platform's ad, would be that instrument. It is a study to commission, not a report to open.
Traits that predict clicking. With per-visitor traits that predict clicking (covariates, to a statistician), a conditional model can estimate the link the counts alone cannot, the paper's own next step [1]. The notebook does not carry it.
A panel. The total needs someone watching the same people on both platforms. It is the only route to a single number.
Try it on your own numbers
Pick one of five synthetic markets, move the shared-visitor count to see the floor and its interval move, dial up the keenness to see how far a floor can sit from the truth, and move the population to see the ceiling. The pinned markets are the ones the notebook stores, and the widget reproduces all of them with the same maths and says so at the bottom.
Caveats to watch out for
Every method has conditions it needs, and the ones below are the conditions this one needs. They are the part of the post worth reading twice.
The click-based figure is a floor under a condition, not always.
People reached on both platforms click more than people reached on one, and the keenest click on both. So the unique reach comes out low: by a fifth on the worked market, and past the point of usefulness on a third of the scored markets. It is a floor while the people on both platforms click at least as readily as each platform's average and their two clicks are linked through who they are. The lists themselves can link them too, as when a lookalike audience is seeded from the other platform's visitors or one customer list is uploaded to both, and that biases the same way. Ecologists gave up long ago on every animal being equally easy to catch [2]. A segment both sides report takes out part of the keenness, and nothing in the reports takes out the rest.
The clicks speak for the observable audience.
A click list can only estimate the people with a real chance of ever being seen [3]. On the worked market, of the people on both platforms, 106,778 had better than a one-in-twenty chance of ever visiting and 33,741 better than one in ten. Estimating even that needs more windows or a third platform, so the post brackets the total and names no single figure.
The chance formula is a ceiling, and only with a population you do not have.
Audiences usually overlap more than chance, by half again on a typical scored market. On one real store's channel lists they overlapped less, and both bounds flipped. With the population guess off by a factor of two either way, the chance figure lands within ten per cent on 59 per cent of markets.
The visitor share is the overlap times the click rates.
About one in a hundred of the worked market's visitors came from both platforms, while one in five of the people it reached was on both. Read straight off the analytics report, it says the audiences barely overlap.
Cookie fragmentation runs the other way.
Every arrival the site cannot tie to the same person shrinks the shared count, and the click-based figure climbs toward the sum. In-app browsers, second devices and cleared cookies all do this. A logged-in identity, such as a customer account, does not fragment. A bare cookie does.
Below a hundred-odd shared visitors the figure is noise.
Thirty shared visitors carry a sampling half-width of about a third, and the notebook refuses below 97. More shared visitors shrink the noise and do nothing for the keenness bias.
Consent scales the shared count.
Dividing the shared count by the consent rate assumes people who declined the cookie overlap the way consenting ones do. Nothing you hold measures that, so my platform reports the shared count as limited by consent rather than corrected.
The reach numbers are estimates of accounts.
Meta's reach is "the number of Meta Accounts that saw your ads at least once" [6], worked out from sampled data [6]. Google's is a modelled count [7]. Every reading here inherits whatever those numbers carry, including that a person with two accounts is two people to a platform.
None of this is an experiment.
Reach says who saw the ad, not what the ad did, and the overlap says whether the second platform found new people, not whether they did anything.
These numbers are from synthetic data.
The market was generated with the answer built in, so every reading could be scored. Yours has a different shape. The method transfers. The numbers do not.
Getting your data
The reach numbers come from each platform's own reporting for the same window, typed in. Both platforms label their reach an estimate, and one counts accounts rather than people. Use each platform's de-duplicated reach for the whole window at campaign or account level, never a sum of ad-set or campaign rows, which counts the people those rows share twice. In Meta's Ads Manager that is the reach column on the campaign's total row with the window set, and in TikTok Ads Manager the reach column for the campaign over the same dates.
Your visitors by platform come from your site, in either of two shapes. The ready-made shape is one line per visitor per platform they arrived from, so a visitor who came from both has two lines:
| column | what it holds | example |
|---|---|---|
visitor_id | the identity your site recognises a returning visitor by | v00017 |
platform | which platform's ad that arrival came from | tiktok |
converted | optional: 1 if this visitor became a customer in the window, else 0 | 1 |
With converted present, the notebook also reports the customers each platform brought alone. The raw shape is a landing log, one line per paid arrival, which the notebook folds into the first shape by reading the platform off the address:
| column | what it holds | example |
|---|---|---|
timestamp | when the arrival happened | 2026-05-03T14:02:11 |
visitor_id | the identity the site recognises the visitor by | v00017 |
landing_url | the address the visitor landed on, click tags and all | https://shop.example/?ttclid=abc123 |
converted | optional: 1 if this visitor bought in the window, on any of their lines | 0 |
Meta's fbclid, TikTok's ttclid, Google's gclid (and gbraid and wbraid), Microsoft's msclkid and LinkedIn's li_fat_id are recognised, and so is a utm_source naming the platform. Arrivals the notebook cannot place are counted and left out.
From a GA4 export in BigQuery the landing log is one query away, provided the property was linked to BigQuery before the window began, because the export does not fill in the past. Without that link, GA4 and a store's own analytics give grouped counts, not visitors. The give-to-your-AI brief carries the query. GA4's user_pseudo_id is a browser or an app instance, not a person, by Google's own definition [9], so the fragmentation caveat applies in full. In opt-in regions it exists only for consenting visitors, so the notebook takes your consent rate and divides the shared count by it.
The identity, in practice. Your site has to recognise the same person on both arrivals, weeks apart. That means a first-party cookie set by your own server (which is what server-side tagging is for) or a login. A cookie written by a script in the page is the fragile case, because in-app browsers, second devices and cleared browsers split it.
Optional inputs. The population the two platforms draw from, for the chance ceiling (without it the ceiling is the sum). Each platform's spend, for the price of an extra person reached. The consent rate. And whether the identity is a cookie or a login.
What it refuses. Visitors from fewer than two platforms. A platform whose reach is smaller than its own visitors, which means the reach figure or the window is wrong. And fewer than 97 visitors from both platforms, where the sampling error alone would exceed twenty per cent. It warns that a cookie identity makes every shared count a floor, and it never estimates the total.
The notebook runs on your own computer. Nothing about your account leaves it.
The same numbers, in production
The platforms' own unique-reach figures are the instrument a site lacks, run by the parties that have it. Google models its unique reach from behaviour across browsers and devices, calibrated on census figures and probability surveys [7, 8]. The paper behind those models lists ad server logs, publishers' user data, census data and a representative panel as the inputs, and the people that come out are modelled stand-ins whose totals match real people [4]. Each model stops at its own platform's boundary.
Across publishers, the UK's Origin runs a single panel of 2,500 homes, matched to publishers' logs without revealing who the panellists are, and reports each platform's reach against the reach de-duplicated across platforms [5]. That is the number this post refuses, produced by the one method that can. For everyone without a subscription, the exact visitor count and the range are what the data supports.
Common questions
How do I calculate unique reach across Facebook and TikTok?
Can I just subtract the visitors who came from both platforms?
Is the click-based number my reach?
What population do I put into the chance formula?
Is TikTok reaching new people or the same ones?
Is the cost per new person reached a cost per acquisition?
We have three platforms. Does it still work?
We only get a few dozen visitors from both platforms a month. Can I use it?
Does a longer window fix the keenness problem?
Should I run a holdout instead?
Try it on your own campaigns
Take one month of one campaign that ran on two platforms. Note each platform's reach for the month from the campaign's total row, then export your site's paid arrivals for the same dates with the click tags left on. Count the visitors who came from both. If there are fewer than a hundred, keep the exact counts and stop there. If there are more, run the notebook and look at the two ends of the range. The next time somebody writes the sum on a slide, you can tell them how many people it counts twice, and how sure anyone can be about the rest.
References
- [1] Chao, A., Pan, H.-Y. and Chiang, S.-C. (2008). The Petersen-Lincoln estimator and its extension to estimate the size of a shared population. Biometrical Journal, 50(6), 957 to 970, pages 957, 960 to 963, 968 and 969.
- [2] Chao, A. (1987). Estimating the population size for capture-recapture data with unequal catchability. Biometrics, 43(4), 783 to 791, page 783.
- [3] Johndrow, J. E., Lum, K. and Manrique-Vallier, D. (2019). Low-risk population size estimates in the presence of capture heterogeneity. Biometrika, 106(1), 197 to 210. Read as the arXiv preprint 1606.02235, pages 1 to 3 (accessed 15 September 2026).
- [4] Skvortsov, E. and Koehler, J. (2019). Virtual People: Actionable Reach Modeling. Google, pages 1 and 2 (accessed 15 September 2026).
- [5] ISBA (2024). Origin: Frequently Asked Questions, August 2024. Incorporated Society of British Advertisers, pages 14 and 17 (accessed 15 September 2026).
- [6] Meta Business Help Center (undated). About Reach Metrics (accessed 14 September 2026).
- [7] Google Ads Help (undated). Measuring reach and frequency (accessed 14 September 2026).
- [8] Google Ads Help (undated). About the Cross-Media report page (accessed 14 September 2026).
- [9] Google Analytics Help (undated). BigQuery Export schema, the user_pseudo_id field (accessed 14 September 2026).
From Stochastic Strata. I build marketing measurement that shows its working: every number carries its range, and when the data cannot answer a question, I say so and tell you what would. The worked example here is synthetic. The method is the real thing, and you can run it on your own data with the notebook or spreadsheet above. Nothing in this post is financial advice.