Seasonality · 11 min read · Interactive · Video
Why do some days always look worse, and when is it actually a problem? Seasonal indices
It is Monday, a little after ten, and somebody has posted Sunday's cost per sale at 30.14 euros next to Tuesday's at 24.14. Usually nothing went wrong. I show how to find each weekday's normal, how much history that takes, and the one case where the method invents a weekend effect that is not there.
The short answer
Usually nothing went wrong. Most ad accounts run on a weekly rhythm, so some days cost more every week whether anything is wrong or not. The fair test is to compare each day with its own normal, never with yesterday or with the weekly average. To find each weekday's normal, divide its average by the average of all your days. That gives one number per weekday, called a seasonal index, the classical method described in Hyndman and Athanasopoulos's forecasting textbook. In my tests, a single week of data was enough to tell weekends from weekdays, while telling two neighbouring weekdays apart was still unreliable after three months. The method has one serious blind spot. If your account is growing or shrinking fast, the trend leaks into the weekday numbers and can invent a weekend effect that is not there.
Sunday is not broken. It is Sunday.
Think of your account as a shop. A shop is busier on Saturday than on Wednesday, and nobody calls a meeting about it. Ad accounts have the same weekly pattern, and the reasons are mostly outside your control: who is online, who else is bidding, what mood people are in when they scroll.
So the question is never "is Sunday dearer than Tuesday?" It nearly always is. The question is "is this Sunday dearer than Sundays usually are?"
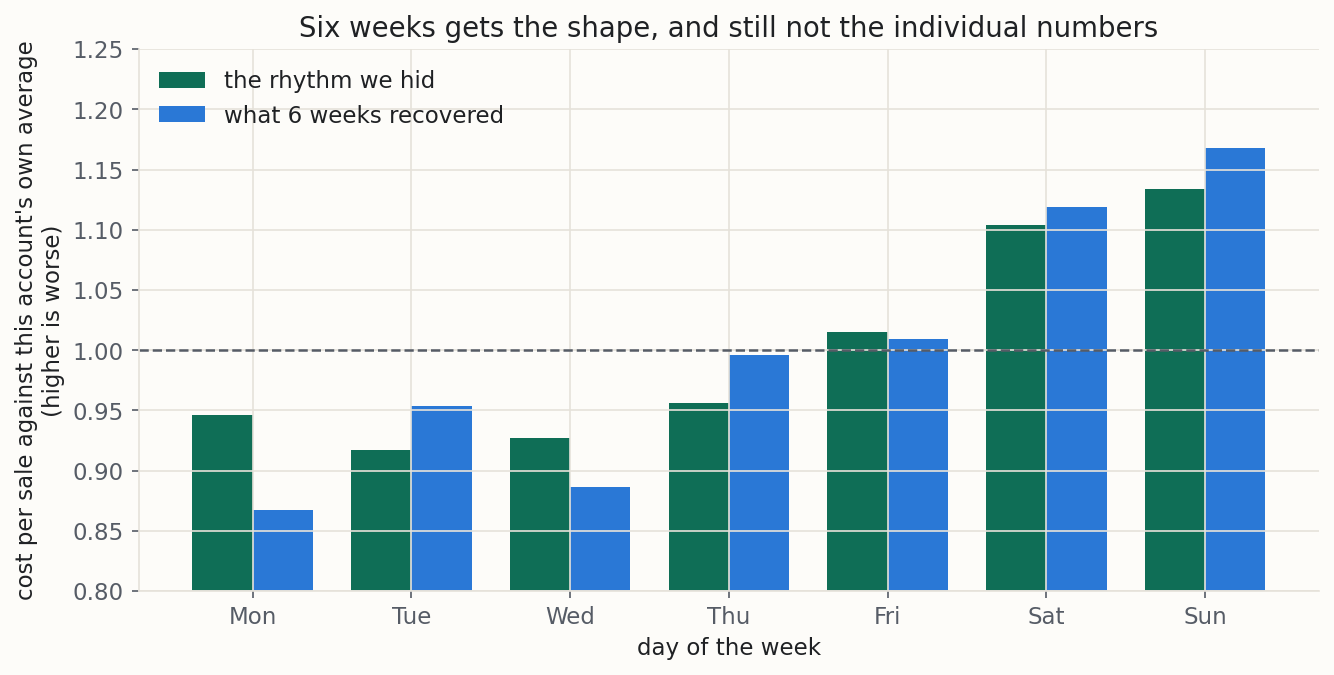
Here is what that changes, on an example account (synthetic, built so the right answer is known in advance). Read from six weeks of its data, a normal Sunday there costs 29.55 euros per sale and a normal Tuesday 24.14. Now two things happen in the same week.
First, an ordinary Sunday comes in at 30.14. Against the weekly average it looks 19 per cent too expensive, and somebody posts a screenshot. Against a normal Sunday it is 2 per cent off, which is nothing.
Second, a genuinely bad Tuesday comes in at 29.46. Against the weekly average it looks only 16 per cent too expensive, so it looks like the smaller worry. Against a normal Tuesday it is 22 per cent off. That is the day something actually went wrong.
The plain average gets both of them backwards. It sends you chasing the innocent Sunday and lets the guilty Tuesday walk past.
Which methods this uses, and why not the others
The method here is the oldest and simplest one there is. Statisticians call it a classical seasonal index [1]. You take each weekday's average and divide it by the average of the whole period. There is nothing to tune, and you can redo every number in a spreadsheet, which I would encourage.
There are three other ways people answer the same question.
Comparing with the same day last week. This is what most dashboards nudge you towards, and it is not silly. It needs only one week of history and anyone can follow it. The trouble is that it pits one noisy day against one other noisy day, so it jumps about from week to week.
A smoothing method called STL. Instead of one fixed number per weekday, it lets each weekday's pattern drift slowly over time [2]. That is a real improvement for an account whose rhythm changes. The price is set-up: its own authors write that it "has several parameters that must be chosen by the data analyst" [2, p. 5]. Somebody has to know how to choose them.
A model that fits the trend and the weekdays together. This is the one that beats mine most directly. My method has a weak spot with growing accounts (more on that below), and this model removes it by giving the growth a place of its own, so it cannot leak into the weekday numbers [3]. The price is that you are now fitting and checking a model, which is a job for an analyst rather than for ten minutes with a spreadsheet.
The textbook that teaches my method is honest about it: classical decomposition "is not recommended, as there are now several much better methods" [1]. I agree. I still start here, because the better methods need someone to run them, and this one needs only you.
The question underneath
Every reporting tool will happily put Sunday next to Tuesday. If your Sundays are built differently from your Tuesdays, that comparison means nothing, however tidy the chart looks.
Large marketing teams do not leave this to the eye. Uber's data scientists built an open-source tool for exactly this separation, to break a marketing number "into trend, seasonality, and marketing channels effects" [4]. They do it because a weekly rhythm is not noise. It is a steady feature of how people buy, and if you do not account for it, every weekend looks like a problem and every genuinely bad weekday hides in the average.
The formula, written out
Here is the one piece of maths in this post. It takes a line, and after it you can check everything else by hand.
indexd = average of every day that fell on weekday d ÷ average of every day in the period
An index of 1.10 means that weekday usually runs 10 per cent above your average. An index of 0.90 means 10 per cent below. Exactly 1 means it is an ordinary day.
Why divide rather than subtract? "Sunday costs four euros more" stops being true the moment your costs move, and it means nothing next to a campaign with different prices. "Sunday runs 14 per cent above average" survives both.
How much history do you actually need?
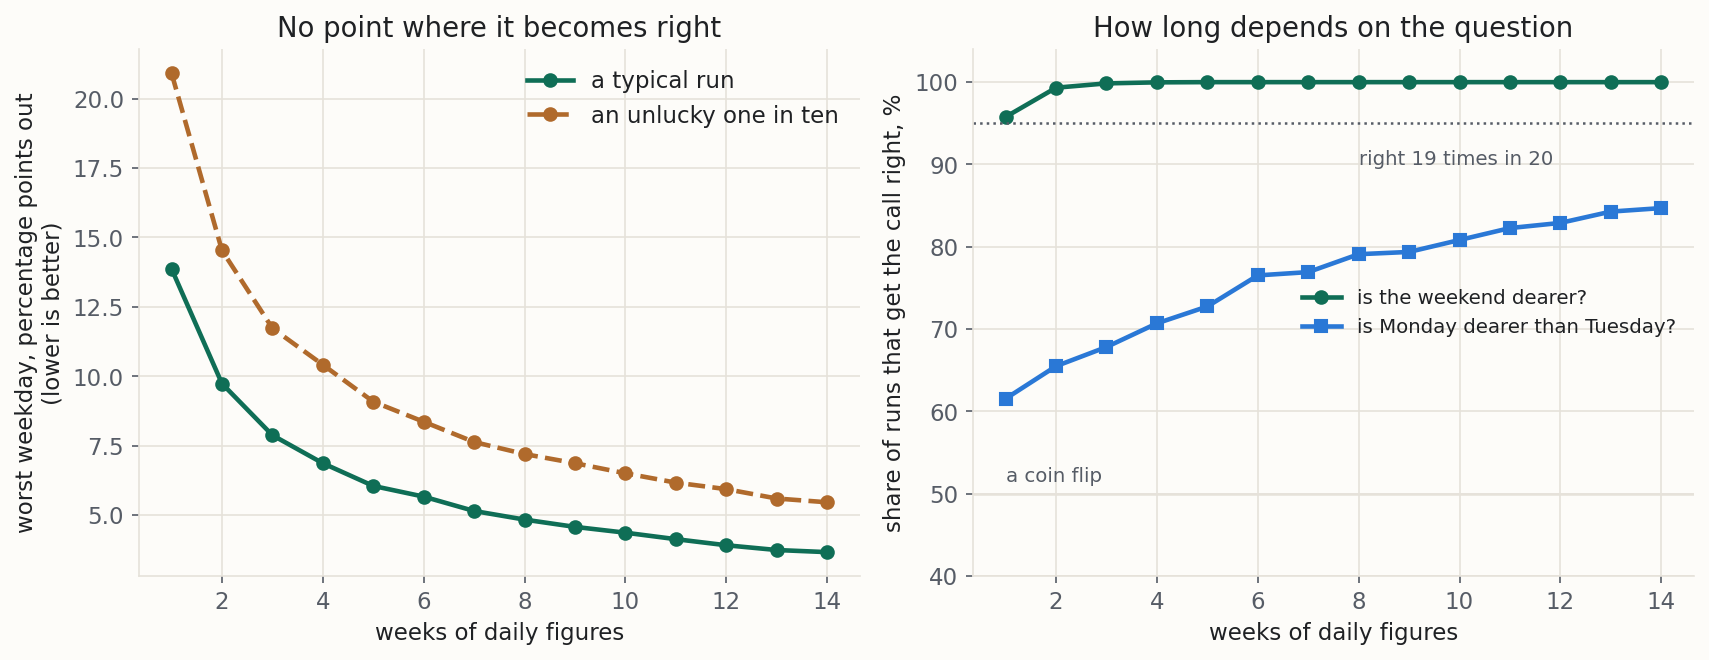
The usual advice is four to six weeks. I wanted to know whether that is right, so I tested it the only fair way: on accounts I built myself, where I knew the true pattern in advance. That is cheating, and it is also the only way to mark a method's homework. I then ran each test four thousand times with fresh random noise, to see how often the method gets it right.
The finding surprised me a little. There is no number of weeks at which the pattern suddenly becomes right. It just keeps getting less wrong, slowly. After one week, the least accurate weekday is typically about 14 per cent away from the truth. After six weeks, about 6 per cent. After fourteen, about 4.
So the useful question is not "how many weeks?" but "how fine is the call I am trying to make?"
If you want to know whether weekends cost more than weekdays, one week is enough. In my tests it got that right 96 times out of 100.
If you want to know whether Monday costs more than Tuesday, you need a great deal more patience. In my example those two days really do differ, by 3 per cent, which is the kind of gap people use to justify moving budget. After fourteen weeks of data, the method still picked the wrong one 15 per cent of the time.
In short: you can see the shape of your week almost at once. You cannot read the fine print for months.
| Weeks of data | Least accurate weekday is off by | Weekend call right | Monday against Tuesday right |
|---|---|---|---|
| 1 | 13.9% | 95.8% | |
| 6 | 5.7% | ||
| 14 | 3.7% | 84.7% |
| The example behind the history test | Value |
|---|---|
| Monday as built (its true level against the average) | 0.95 |
| Monday as read from six weeks of data | 0.87 |
| How far off that is, in points of your own average | 7.9 |
| Weekend against working week, true gap | 16.7% |
| Monday against Tuesday, true gap | 3.0% |
Does the pattern hold next month?
Sensible advice says: work out your pattern on one stretch of data, then check it repeats on the next. Do that. It costs nothing. Just know that it is a much weaker check than it sounds.
The problem is that two stretches of data never match exactly, even when nothing has changed, because each one carries its own random noise. So to raise an alarm, a difference has to be bigger than noise alone would produce. I set that alarm so that a perfectly stable account would trigger it only one time in twenty.
Then I tested it on accounts whose weekend premium really had collapsed, halving: Sunday went from 13 points above the average day to 7. Four out of five of those changes slipped under the alarm.
| Checking next month against this month | Value |
|---|---|
| Typical worst-weekday gap between two six-week windows of a stable account, from noise alone | 0.078 |
| Alarm line, crossed by one stable account in twenty | 0.131 |
| Real change tested: the weekend premium fell by (points of the average) | 6.7 |
| Real changes that crossed the alarm | 19.8% |
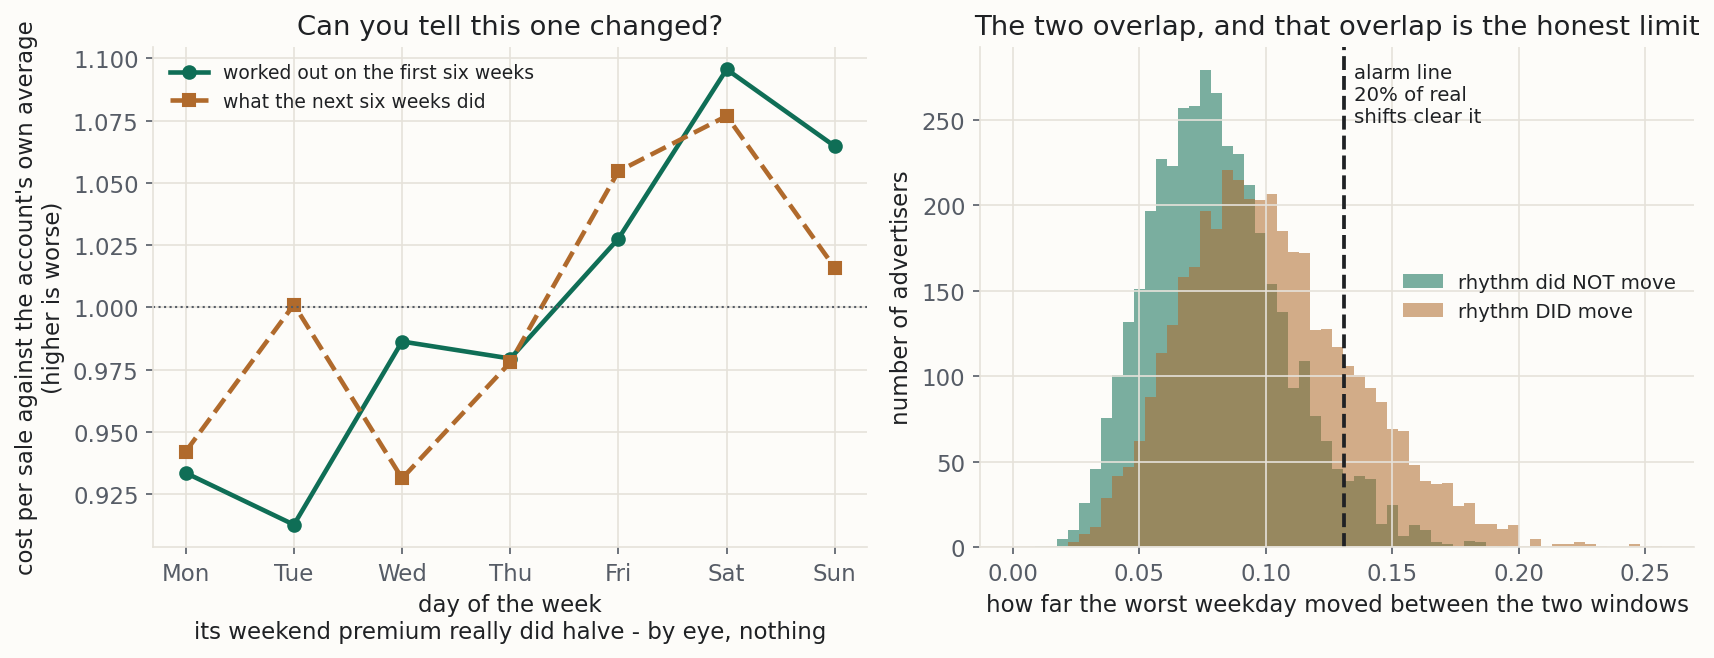
So when the check fails, believe it. When it passes, read it as "nothing big enough to see", which is a much smaller compliment than "confirmed".
Try it on your own numbers
Set how much history you get, how strong the real weekly rhythm is, and how fast the account is drifting, and watch what the method recovers against the truth it was given. Then do the thing no dashboard lets you do: set the real rhythm to zero and turn the drift up. The pattern it reports is then entirely manufactured, and it looks exactly like a weekend effect. The four pinned cases are the ones the notebook stores, and the widget reproduces all of them and says so at the bottom.
Caveats to watch out for
Every method has situations where it gives a confident wrong answer. These are this one's, in order of how often they will catch you, most common first.
A growing account invents a weekend effect.
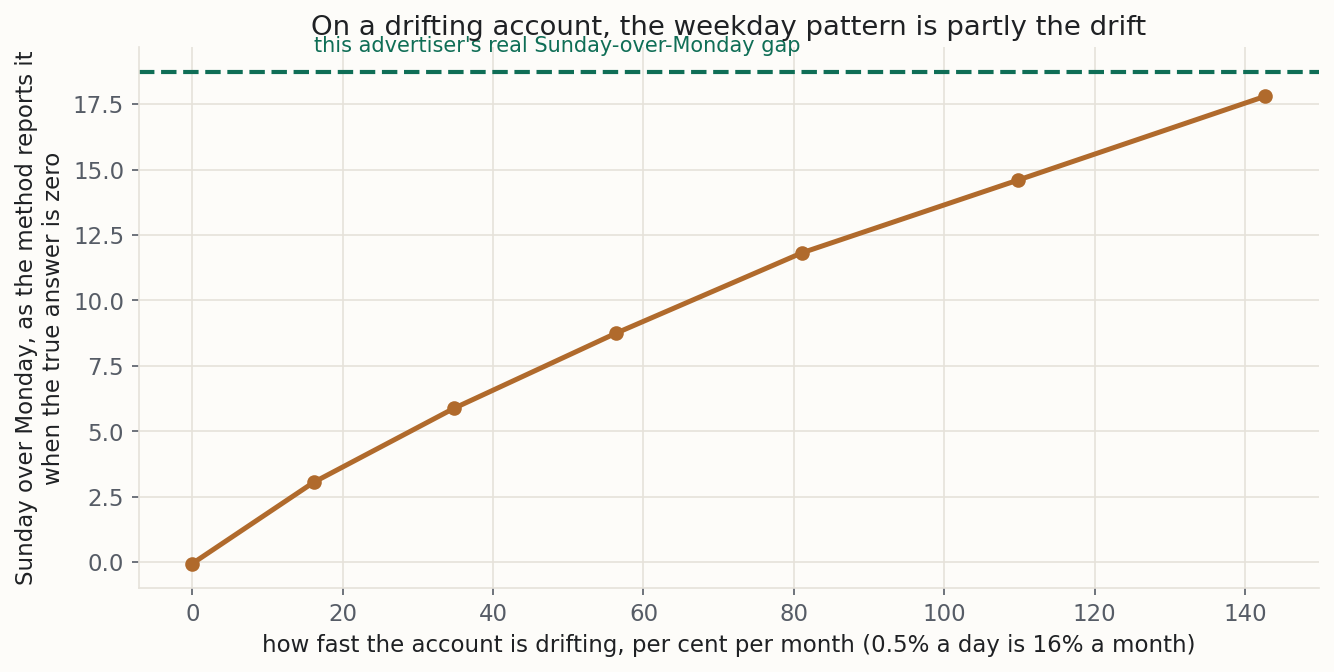
The method compares each weekday with the average of the whole period, which is only fair if the account sat at one level throughout. If costs were climbing, the later days of each week are measured at a slightly higher level than the earlier ones. In any run of whole weeks, Sundays come later than Mondays. So a climbing account makes Sundays look dearer, and the method cannot tell that apart from a real weekend premium. How big is it? On an example account with no weekly rhythm at all, costs rising 2 per cent a day for four weeks put Sunday nearly 12 points above Monday, out of thin air. The notebook warns when the second half of the window runs 15 per cent or more off the first; a slower climb gets no warning and still tilts the week. If your account is scaling hard, part of the pattern you are reading is the scaling.
It reads weekdays, not seasons.
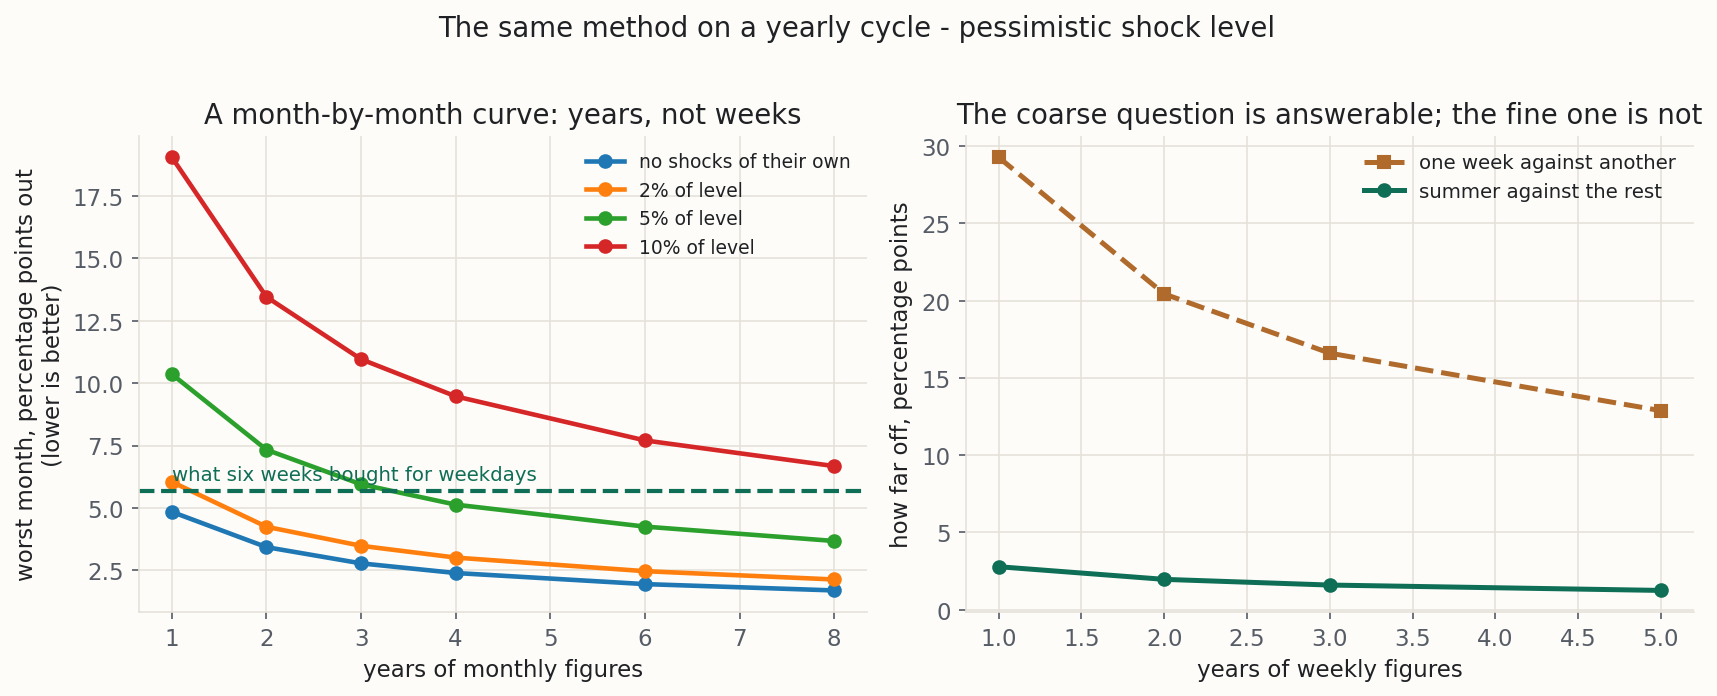
When most marketers say seasonality they mean summer, Christmas and a quiet January, not Tuesdays. In principle you could swap "every Tuesday" for "every July". The problem is counting. Each week gives you one more Tuesday, but each year gives you only one more July. To learn your months as well as six weeks teaches you your weekdays, you would need somewhere between four and more than eight years of history, and no account stays the same for that long. The classical method assumes the pattern repeats unchanged from year to year [1], which is precisely what an account does not do. There is a coarser question you can answer, and it is often the one you really meant. Skip the month-by-month curve and ask: is this stretch of the year different from the rest? That pools many weeks against many weeks, and in my tests one year of weekly figures answered it reliably.
One strange week spoils the pattern.
A Black Friday, a site outage or a broken tracking tag lands on particular weekdays and drags their numbers around. Take those periods out before you start, and certainly before you have seen an answer you like.
It cannot tell you why.
It will tell you that Sunday costs more. Whether that is a different audience, fewer advertisers bidding or a checkout page that struggles at the weekend is not in these numbers.
Small numbers fool it.
Use costs and rates, not raw counts. A Tuesday with two sales and a Wednesday with one are not "a third apart" in any useful sense. Cost per sale has its own trap on a quiet account: on a day with no sale, it does not exist, and leaving those days out keeps only the lucky ones. In my quiet test account that made weekends look nearly 40 per cent cheaper than they really were. The fix is to give the notebook your spend and your sales as two separate columns, and it works from the totals instead.
| The numbers behind these caveats | Value |
|---|---|
| Sunday premium invented by a 16.1% drift over a month (true premium: none) | 3.1% |
| Sunday premium invented by an 81.1% drift over a month | 11.8% |
| Weekend gap a real weekly rhythm produces in the same account | 18.7% |
| Years of history a month-by-month index needs, if each month carries shocks worth 5% of the level | 4 |
| Years needed if a month is as jumpy as a day | more than 8 |
| Summer stretch tested: 13 weeks, above the rest of the year by (points) | 23.5 |
| After one year: summer contrast within (points) | 2.8 |
| After one year: summer contrast direction right | 100% |
| After one year: worst single week still off by (points) | 29.3 |
| Quiet account, weekend read from cost per sale with no-sale days dropped (truth: 1) | 0.62 |
| Same account, weekend read from the totals | 1.05 |
Getting your data
You need a file with one line per day and two columns:
| column | what it holds | example |
|---|---|---|
date | the calendar date | 2026-03-17 |
value | the number you want the weekday pattern of | 24.80 |
Use one campaign at a time. A weekday pattern averaged across campaigns with different rhythms describes none of them.
From an ad platform, export a daily report for one campaign and make sure it is not rolled up by week. From a web analytics tool, group by date and work out the metric for each day.
Point the notebook at your file and it validates before it computes: a metric with zeroes or negatives in it, dates that appear twice, or a weekday that never appears at all each produce a refusal in plain words rather than a confident number the data cannot support.
The notebook runs on your own computer. Nothing about your account leaves it.
Common questions
Should I switch off the expensive days?
How long before I can trust it?
Does this work for my summer high season?
My pattern looks different every month. Why?
Can I use it to set bids by day of the week?
What if a weekday is missing from my data?
Try it on your own account
Export the last six weeks of one campaign, one line per day, with cost per sale in the second column. Work out the seven numbers and look at Sunday. If it sits near the top, you have just met your weekly rhythm, and next Monday you can answer the screenshot before anyone has finished their coffee.
The notebook above does the arithmetic for you, including the refusals when the data cannot support a reading. The spreadsheet carries the same arithmetic in live formulas, with a sheet you paste your own days into. Both run on your machine and neither uploads anything.
References
- [1] Hyndman, R. J. and Athanasopoulos, G. (2021). Forecasting: Principles and Practice, 3rd edition, section 3.4, "Classical decomposition". OTexts, Melbourne. otexts.com/fpp3/classical-decomposition.html (accessed 11 September 2026).
- [2] Cleveland, R. B., Cleveland, W. S., McRae, J. E. and Terpenning, I. (1990). STL: a seasonal-trend decomposition procedure based on loess. Journal of Official Statistics, 6(1), 3 to 73.
- [3] Hyndman, R. J. and Athanasopoulos, G. (2021). Forecasting: Principles and Practice, 3rd edition, section 7.4, "Some useful predictors". OTexts, Melbourne. otexts.com/fpp3/useful-predictors.html (accessed 12 September 2026).
- [4] Wu, Y., Elkin, L., Ng, E., Yang, S., Jiang, A. and Pan, J. (2021). Introducing Orbit, an open source package for time series inference and forecasting. Uber Engineering blog, 14 May 2021. uber.com/blog/orbit (accessed 11 September 2026).
All figures in this post come from the accompanying notebook, which builds its own example data with the right answer known in advance, so every result can be checked against the truth. The data is synthetic throughout.
From Stochastic Strata. I build marketing measurement that shows its working: every number carries its range, and when the data cannot answer a question, I say so and tell you what would. The worked example here is synthetic. The method is the real thing, and you can run it on your own data with the notebook or spreadsheet above. Nothing in this post is financial advice.