Creative fatigue · 20 min read · Interactive · Video
Is my ad wearing out, or did something else change? Segmented regression on exposure
It is Thursday, the weekly call, and your best ad is on the shared screen. Last month it pulled a 1.8% click-through rate. This week it is doing about two-thirds of that. Somebody says the creative is tired, everyone nods, and by the end of the call a designer has a fortnight of work called "the refresh".
Sometimes that is right. But the rule most accounts decide with (down a fifth from the best week this ad ever had) cannot tell a tired ad from a bid change, and on a low-volume creative it flags 53.2% of ads whose rate never moved at all. The more careful rules are written in days. Fatigue does not run on days. This post is about what it does run on, and how to tell before the designer starts.
The short answer
An ad is wearing out only if its response falls as the same people see it again, so measure it against exposure, never against the calendar. Exposure is how many times the average person reached has now seen the ad: impressions to date divided by people reached to date. Plot the daily click-through rate against that number and fit a flat line that bends into a decay, which statisticians call segmented regression (Muggeo, in Statistics in Medicine). The fit reads where the ad stood, when it started to tire and how fast, each with a range.
In my tests on ads whose rate never moved, the usual "down a fifth from its best week" rule flagged about half of the low-volume ones, while the fit flagged none.
The method cannot tell repetition apart from anything else that rises with exposure, such as colder traffic as an audience runs out. The caveats to watch out for are the important part.
The question underneath
"Is my ad wearing out?" is two questions wearing one coat.
The first is easy: is this ad doing worse than it was? Any dashboard answers it.
The second is the one the call is really asking: is it doing worse because people have seen it too many times? The two have different fixes. If the creative is tired, new creative fixes it. If a competitor has just entered your auction, new creative costs a fortnight of production and changes nothing, because the new ad walks into the same auction and does the same thing.
Google's own troubleshooting page lists what else moves these numbers: edits to your bid strategy, bids, budget, keywords, audiences, demographics or ad schedule, and the choices of other advertisers bidding in the same auctions [1]. None of those is your creative. All of them look exactly like fatigue on a chart of click-through rate against time.
Why days are the wrong unit
Fatigue has a mechanism, and the mechanism is not time. It is an audience running out, so that each new impression is more likely to land on someone who has already seen the ad. Meta puts it from the platform's side: an audience drawn too narrowly can "lead to creative fatigue as the same users see your ads again and again" [2]. Time stands in for that only while delivery is slow and steady.
Across kinds of inventory it fails by a factor of ten. A search creative takes weeks to reach the exposure a short social video reaches in days. Any rule written in days ("compare the last week against days eight to twenty-one") is tuned for one of them and wrong for the other.
My own first version was written that way. On a creative that loses 45% of its rate in its first week and then holds, both calendar windows sit after the decline, measure the tired rate as the "baseline", and call the creative steady 97.0% of the time.
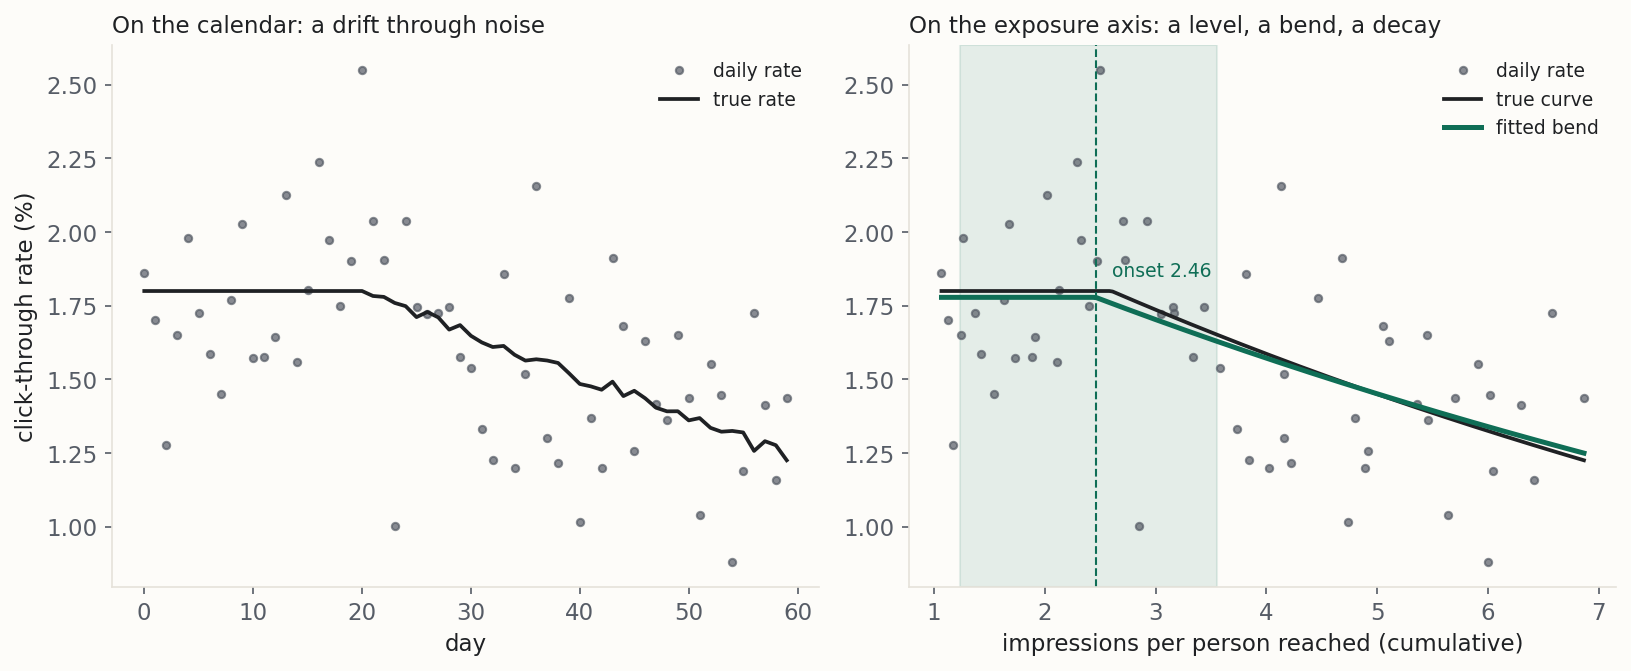
Put both creatives on the exposure axis (impressions delivered so far, divided by the distinct people reached so far) and they become the same problem.
The formula, term by term
Here is the maths: three lines, each followed by what it means in words. The axis first:
f = impressions delivered to date ÷ distinct people reached to date
That is how many times the average person reached has now seen the creative. Platforms report reach by the day at best [3], which is enough.
Then the shape. The response holds at a settled level up to a bend, then loses a fixed share of what is left for every extra impression per person:
p(f) = a for f < ψ
p(f) = a · e−λ (f − ψ) for f ≥ ψ
- a, the settled level: the click-through rate before any fatigue, fitted from the curve rather than placed by a window.
- ψ, the onset: the exposure at which response begins to fall. On the worked creative, 2.46 impressions per person.
- λ, the decay: the share of what is left that each further impression per person costs. A λ of 0.080 means each extra impression on the average person takes about 7.7% of what remains, one click in thirteen.
- f, where the creative is now. The worked creative went from 1.07 impressions per person on its first day to 6.87 on its last.
The fit weights each day by its impressions, so a thin day counts for less than a heavy one (weighted least squares, to a statistician). It tries every onset and decay on a grid, and the widget below runs the identical sums in your browser. This is the segmented-regression estimator: a flat stretch joined to a sloping one at a break that is itself estimated [4].
I fit the bend rather than hand it to a change-point detector, because finding a change in slope is a harder problem than finding a jump in level, and the usual detectors do not solve it [5].
Two rules keep the fit honest, both set by measurement. A bend is reported only when it beats a flat line by a clear margin, so a creative whose rate never moved returns no onset. And a bend needs at least three points before it and five after it, with the falling side covering at least 15% of the exposure seen. Otherwise the fit will happily put a steep decay on the last handful of points.
The ranges come from the same grid: every onset and decay that fits within the usual cut of the best fit is inside its range.
The fallback rung: the no-change range
When there is no bend to fit (a creative too young, or one whose exposure never moved), the method compares a settled early stretch with the last seven days and asks where this week would land if nothing had changed. A click-through rate is a proportion, so that has a standard error you can write down.
no-change range = p₀ ± 2 √( p₀(1−p₀)/n₀ + p₁(1−p₁)/n₁ )
Here p₀ and n₀ are the early window's rate and impressions, and p₁ and n₁ the current week's. Landing below the band is a drop of two standard errors, said in a way you can take to a meeting.
The value of 2 comes from Shaw's 2025 paper on screening for fatigue, which asks a detected change to clear a two-standard-error gate before calling it fatigue [6]. Shaw divides by a calibration-period scale where I use the standard error of a proportion, and there the gate is a secondary check where here it is the whole rung. A relative floor of 10% rides alongside, because at very high volume a drop too small to matter commercially still clears any noise gate.
This rung reports a decline and its size. It reports no onset and no decay rate, because it has neither.
Because its windows sit on the calendar, it also needs a check the exposure axis gives the top rung for free: exposure must have risen materially across the current week. The obvious version ("is the trend above zero?") is no test, because on a creative whose exposure is flat, day-to-day noise alone puts the trend above zero half the time.
I ran two thousand simulated copies of a creative that fell for an outside reason (a single step down in its rate, so the figure speaks for that cause only). The bare "above zero" test passed 50.8% of them as fatigue, about one in two.
The fix is a floor: exposure must rise by at least 5% across the week, as a share of the week's own average. That floor passed 2.3% of the same creatives, 46 of 2,000. The trend is the median of the slopes between every pair of days [7] [8], so a single promoted day cannot swing it.
A worked example
The data below is synthetic, built so the right answer is known in advance. The notebook generates it with the truth built in, which is the only way to score a method honestly: on real data nobody knows which ads were truly tired.
The simulation runs sixty days of nine creatives, three volume levels by three truths. Some are steady, with a rate that never moves. Some genuinely wear out: their reachable audience fills up, exposure climbs, and the rate falls with exposure from a known onset at a known speed. Some fall for an outside reason on a single day, with exposure flat throughout.
The one that is genuinely wearing out. At 2,500 impressions a day the fit reads an onset at 2.46 impressions per person, against a true 2.6 that the generator wrote in. Every true value lands inside its range. By its last day the creative had lost 29.7% of its response, close to a third. At 12,000 impressions a day the same shape comes out tighter.
| Fitted at 2,500 a day | Range | Truth | Fitted at 12,000 a day | Range | |
|---|---|---|---|---|---|
| Settled level | 1.779% | 1.698% to 1.859% | 1.8% | ||
| Onset, impressions per person | 2.46 | 1.23 to 3.56 | 2.6 | 2.38 | 2.00 to 2.88 |
| Decay per impression per person | 0.080 | 0.049 to 0.125 | 0.09 | 0.080 | 0.067 to 0.091 |
The one that fell harder and is not tired at all. Its rate stepped down about as far as the tired one's, a 30.2% drop, but its exposure barely moved, so there is no axis to fit a bend on and the method steps down a rung. On a click-through chart it looks worse than the tired creative. Exposure did not rise across the week, so the verdict is decline, cause unknown, not fatigue. Replacing that creative would have been a fortnight of work aimed at the wrong thing.
The one too thin to fit. At 400 impressions a day (about 7.2 clicks) the same worn-out shape is there, but through that much noise a bend cannot be told from a flat line. The current week sits below the no-change range and exposure rose, so the verdict is wearing out, range only: a decline and its size, with no onset and no rate, because the data cannot support them.
| Fell for an outside reason | Too thin to fit | |
|---|---|---|
| Early window rate | 1.942% | |
| Current week | 1.276% | 1.305% |
| No-change range | 1.728% to 1.931% | 1.377% to 2.506% |
| Drop | 30.2% | 32.8% |
| Drop in standard errors | 10.89 | |
| Exposure | moved 0.091 across sixty days, no rise in the week | up 7.3% across the week |
| Verdict | decline, cause unknown | wearing out, range only |
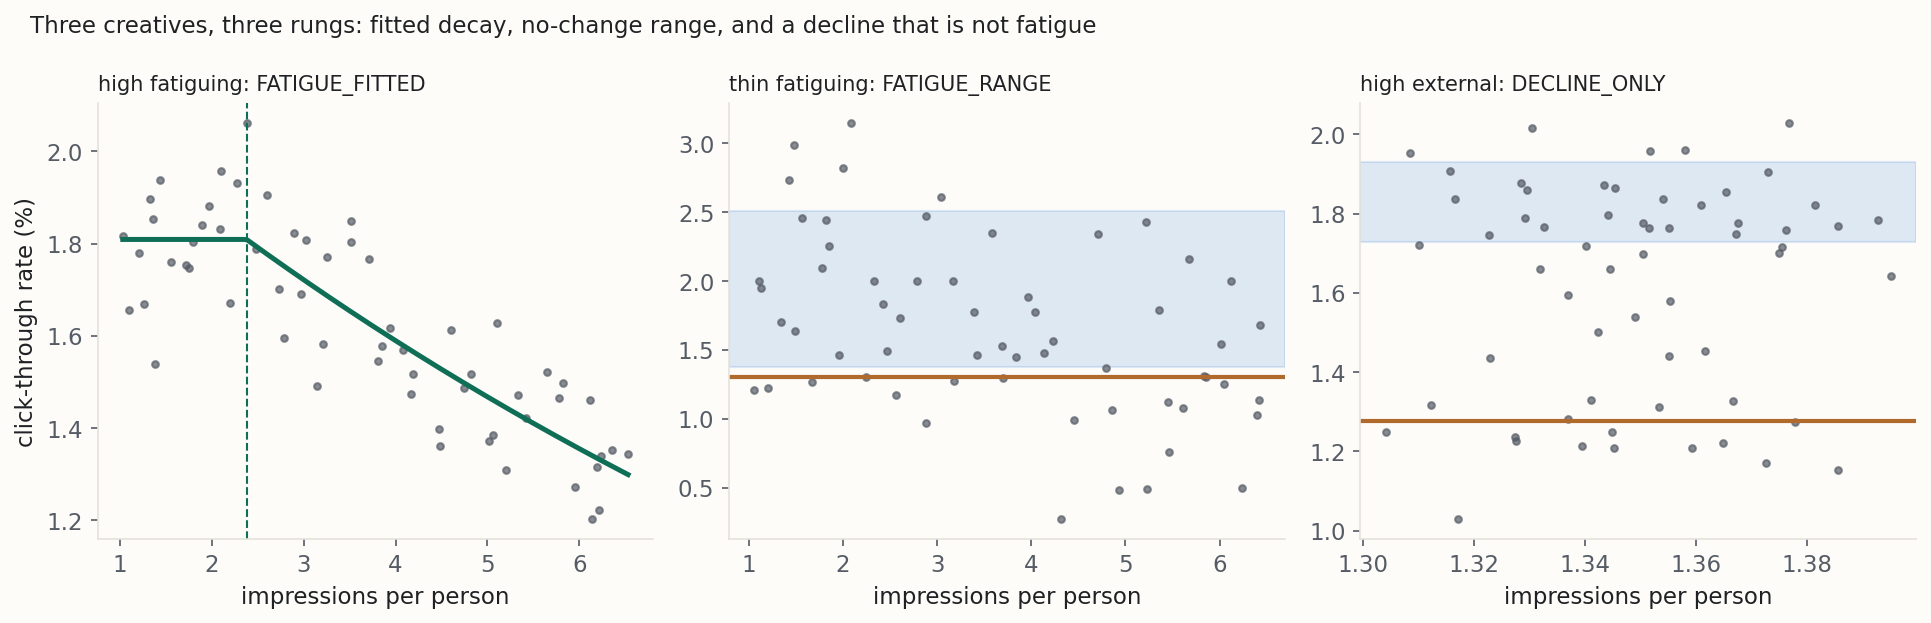
That trio is the ladder: a fitted decay when the curve supports it, the no-change range when it does not, and silence below the floor.
The fast one
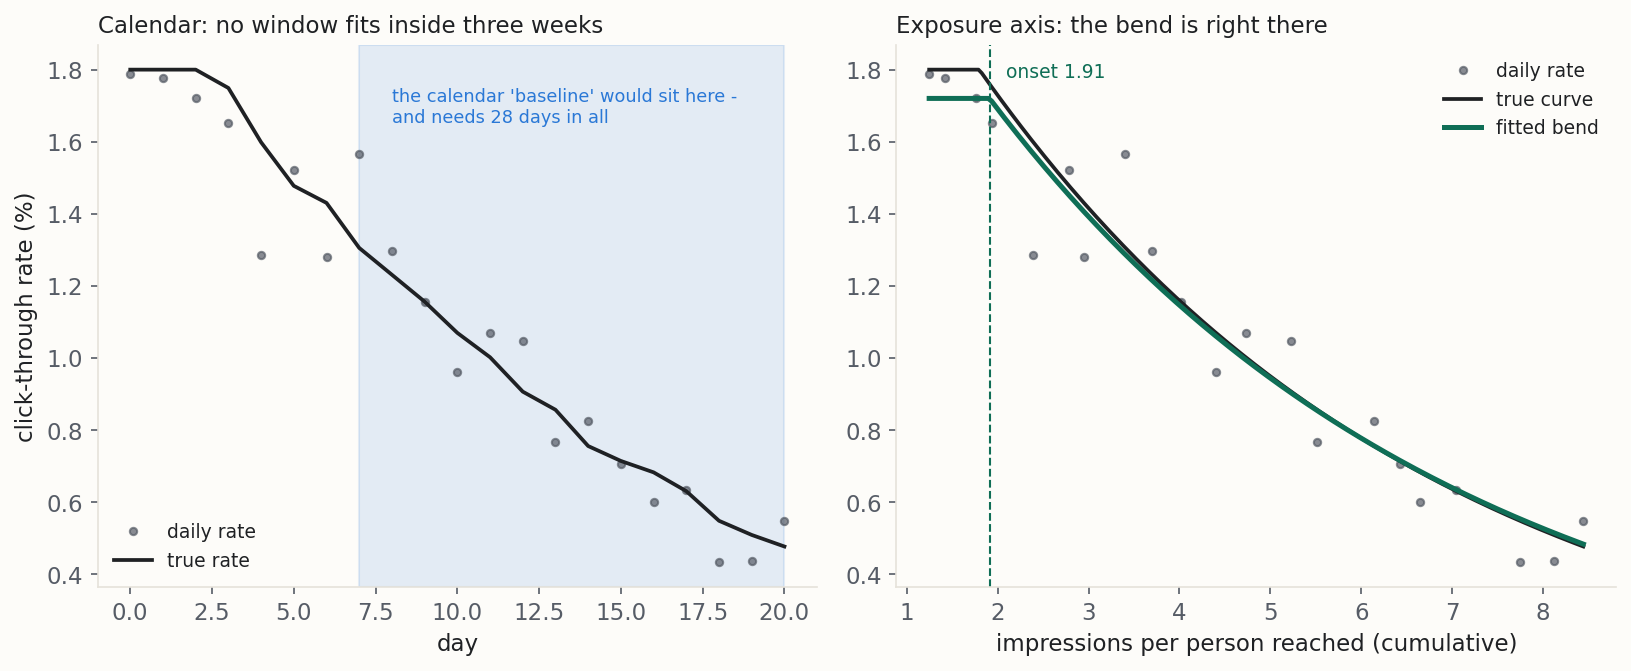
Here is the creative the calendar could never see: a three-week social creative with a small audience, seen 2.95 times by the average person by day seven.
The calendar windows need 28 days of history, and this creative ran for 21. My first version returned nothing at all.
The exposure fit reads an onset at 1.91 impressions per person, against a true 1.8, and a decay of about a sixth of what is left per extra impression. It finds the creative has already lost 71.9% of its response, nearly three clicks in every four.
| The fast one | Fitted | Range | Truth |
|---|---|---|---|
| Onset, impressions per person | 1.91 | 1.91 to 2.24 | 1.8 |
| Decay per impression per person | 0.194 | 0.172 to 0.212 | 0.20 |
| Exposure on day seven | 2.95 | ||
| Exposure on its last day | 8.44 | ||
| Response lost by the end | 71.9% |
Does the fit find the truth, and does it invent one?
I measured both. Over three hundred such three-week creatives the fit reported a bend on every one, within a tenth of an impression per person of the true onset on 53.7% of them, and mostly late. The range is the weak part on fast inventory: its lower edge is usually the lowest onset the fit allows, three days into the data, so it marks a limit of the method rather than a measurement, and it held the true onset on only 68.7% of them, against the 95 in a hundred a range promises.
| Over three hundred fast creatives | Median | Middle half |
|---|---|---|
| Bend reported | 100.0% | |
| Onset error, impressions per person | 0.079 | -0.024 to 0.258 |
| Fitted decay as a multiple of the true one | 1.033 | 0.97 to 1.076 |
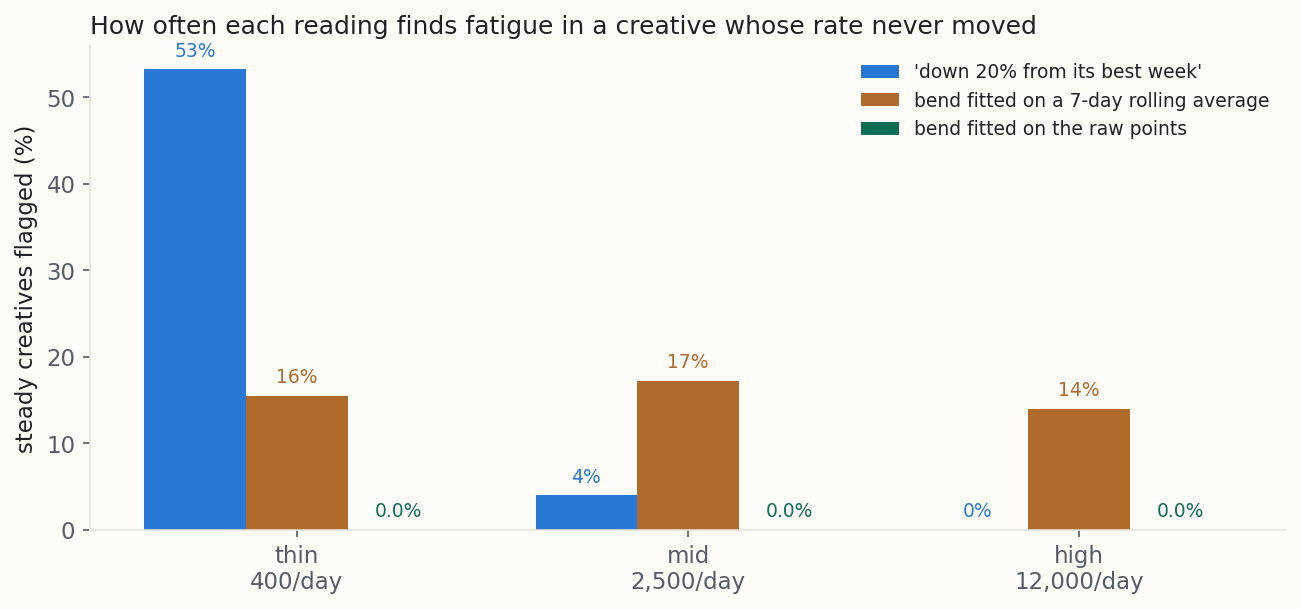
Then the other direction: four hundred simulated creatives per volume level, every one with a rate that never moves. Here every bend and every alarm is false by construction.
| Daily impressions | "Down 20% from its best week" | Bend fitted on a 7-day rolling average | Bend fitted on the raw points |
|---|---|---|---|
| 400 | 53.2% | 15.5% | 0.0% |
| 2,500 | 4.0% | 17.2% | 0.0% |
| 12,000 | 0.0% | 14.0% | 0.0% |
The reflex rule fails where you needed it, on the small creatives, and behaves where you did not. The rolling average in the middle column is the surprise, because it is the first thing anyone reaches for. As a detector it invents a bend on 14 to 17 healthy ads in a hundred at every size: smoothing makes neighbouring days share data, and the test reads that shared structure as a bend. Smooth the line to show the curve. Take the verdict from the unsmoothed fit.
What the gate costs when it is wrong
Two hundred creatives of each truth at the highest volume, run through the whole ladder:
| The truth | Called steady | Called decline, cause unknown | Called wearing out, range only | Called wearing out, fitted |
|---|---|---|---|---|
| Steady | 99.5% | 0.5% | 0.0% | 0.0% |
| Genuinely wearing out | 0.0% | 0.0% | 0.0% | 100.0% |
| Fell for an outside reason | 0.0% | 99.5% | 0.5% | 0.0% |
Read the bottom row. Outside-cause declines that still read as fatigue are rare. The larger run at the gate put that leftover at 2.3%, and it is day-to-day noise in the exposure figures clearing the 5% bar, so noisier exposure data lets more through. A real cause that pushes exposure up in the same week, which this simulation does not contain, would look identical to fatigue on top of that.
What defeats both, and what a second bend does about it
One shape defeats the calendar windows and the fit alike: the creative that drops in its first week and then holds. The windows call it steady almost every time. The exposure fit does little better, reporting a bend on only 10.0% of these creatives, for two reasons the method names itself. The decline starts before three days are in, so there is no level to fit a bend from. And a decline that then holds is not a decline that continues, which is the only shape a single bend can express.
Both readings hand back healthy on a creative that has lost nearly half its response, which is worse than handing back nothing.
The obvious extension is a second bend. Let the rate decay from an onset, then switch to a second rate from a stop point, and leave that second rate free: zero if the decline stopped, negative if the creative is coming back, steeper if it is falling faster. That is five numbers instead of three. It is built into the notebook, and it is reported only when it beats both the single bend and a flat line by the same margin a bend must beat a flat line. The second condition carries the weight. A model that contains the single bend fits every ordinary tiring creative at least as well, so a margin against the flat line alone would hand it all of them.
On the same 300 drop-then-hold creatives it found the shape on 92.3% of runs, and read the tail as stopped on almost all of those. The decline it reports runs low, a median of 41.0% against the true 45%. The cause is the rule asking for three points before the first bend, which pushes the onset later and folds part of the fall into the level. Erring low is the safe direction for a screen.
What it costs matters more, because a bigger model always fits better. On steady creatives with climbing exposure it fired on none of 150 runs, and on tiring creatives the single bend already reads correctly, again none of 150. Once its extra numbers are charged for, it fits worse than the single bend there, while on the two shapes it exists for it clears the margin four times over.
| Drop-then-hold creatives | Result |
|---|---|
| Exposure by day seven, one example | 3.47 impressions per person |
| Calendar "baseline" window, one example | 0.99% against a true starting rate of 1.8% |
| Called steady by the calendar windows | 97.0% |
| Bend reported by the single-bend fit | 10.0% |
| Shape found by the second bend | 92.3% |
| Of those, tail read as stopped | 96.0% |
| Stop point, median | 3.37 impressions per person |
| Decline reported, median | 41.0% (truth 45%) |
| Second bend firing on steady creatives with climbing exposure | none of 150 |
| Second bend firing on tiring creatives one bend reads correctly | none of 150 |
The second bend is not part of the verdict. The ladder still reports the single bend, because a measured extension is not a shipped one.
What real data said
I also ran the fit on thirty days of real display impressions from a public Criteo dataset: 31 campaigns with three weeks or more of activity and at least a hundred thousand impressions each. Every one ended the month between about 1.7 and 3.3 impressions per person, below where most of the simulated decline happened.
The daily reading found a bend in none of them, and neither did the controls with the days or the hours shuffled. An hourly reading found a late-month bend in 9.7% that survived both controls, which could be fatigue or a campaign change.
So the real data checked that the fit does not invent structure on real noise, and could not check the fatigue call, because nothing in it was seen often enough. The second bend found a dip followed by a recovery in 15 of the 31, and in none with the days shuffled, so "no bend" there was partly the model having nowhere to put the shape. (Criteo reports campaigns, not single creatives.) The real test of the fatigue call is owed on inventory that people see hard: social, in-feed video, retargeting at real frequency. Until it runs, the numbers above are simulation, and I say so.
| 31 Criteo campaigns | Result |
|---|---|
| Exposure at month end, median | 2.33 impressions per person |
| Exposure at month end, spread | about 1.7 to 3.3 |
| Bend found, daily reading | 0.0% |
| Bend found, hourly reading, surviving both controls | 9.7% |
| Dip then recovery, second bend | 15 of 31 |
| Dip then recovery, days shuffled | none |
Getting your data
This runs on one table, one row per creative per day:
| column | meaning | example |
|---|---|---|
creative_id | any stable identifier for the ad | ad_44192 |
date | the day | 2026-08-14 |
impressions | impressions served that day | 2841 |
clicks | clicks that day | 47 |
reach | people reached to date, cumulative | 18240 |
There are two ways in. If your platform hands you a ready-made export with one row per creative per day, use it directly. If all you have is a finer log (one row per placement per day, or per impression), the notebook rolls it up for you.
The reach column builds the axis, and it is the one that matters. Without it there is no exposure, no bend and no fatigue call, only a decline from the fallback rung with no way to name its cause. And reach must be to date: everyone reached from the creative's first day up to that row's day.
A by-day report does not give you that. Meta's and TikTok's by-day reach is each day's own unique reach, and their by-day frequency is each day's own frequency. Summed or maxed across days, neither is reach to date, and an axis built from them reads wrong without any warning. The notebook refuses a reach column that falls from one day to the next or never exceeds a single day's impressions.
To get reach to date, ask for reach over ranges that start at launch and end on each day. Meta's Insights API takes a whole list of them in one call. If you have frequency to date, hand that over instead. If you have neither, the notebook will tell you it can see a decline and cannot attribute it, which is the correct answer and not a degraded one.
The request for reach to date ships in the notebook and in the give-to-your-AI brief. The file can be a CSV or an .xlsx download as it comes, with Total rows, formatted numbers and the platforms' own column names left in. The spreadsheet takes up to sixty days pasted from the top. Everything runs on your own computer. Your file is read from your disk and nothing is uploaded anywhere.
Try it on your own numbers
Set where a creative's response bends and how fast it decays, how much it serves and how many people it can reach, and watch the fit read the shape back, with its ranges. The four presets are the cases the notebook pins. The widget reproduces all of them, and says so at the bottom.
Caveats to watch out for
Every method has conditions it needs, and the ones below are the conditions this method needs. They are the part of the post worth reading twice.
Exposure is the coordinate, not the cause.
The method says response fell as exposure built up. It does not say repetition did it. The old effective-frequency research makes the same point. Naples found that more frequency keeps building effectiveness at a slowing rate with no sign of a decline, and conceded that too much frequency can hurry along the decline of an ad that was working, while "frequency alone does not appear to cause declines" [9]. Neither contradicts this method: a creative whose response never falls fits no bend, however high its frequency. The fit reads a shape, and the cause stays an inference.
A rising-exposure decline can still have another cause.
The exposure axis takes the flat-exposure cases out of the fatigue call. It cannot remove a cause that moves with exposure. Audience quality slipping as the reachable pool runs dry looks exactly like fatigue. So does a bid strategy pulling in colder traffic while exposure climbs. No arithmetic separates those from fatigue, because it is a limit of what can be observed.
The refresh-versus-retire boundary is a business call, not a fitted one.
The published evidence for real weariness, where extra exposures actively hurt rather than merely stop helping, comes from a large study by Chae, Bruno and Feinberg, which found about a quarter of viewers reaching that state [10]. It is one study, its authors call the finding unplanned, and it rests on exposure being effectively random: ads were allocated by publisher, not by person, so "ad exposures are randomly served across both users and time within a publisher's website" [10]. Your account is the opposite by construction. Exposure there rises because you raised a budget, narrowed an audience or ran out of people, and each of those also changes who is being reached. So the line between refreshing and retiring is your judgement of how much decline you will tolerate, set on the fitted decay and level together.
Ads recover, and ads level off, and this model has one bend.
Among the synthetic case histories Shaw's paper uses to illustrate its detector is one named Fatigue and Recovery: a decline followed by a partial rebound [6]. The nearest measurement here is the real-data run, where the second bend found that shape in 15 of 31 campaigns. A single bend has nowhere to put it. A creative that dipped and came back reads as tired if you score it during the dip, and one that dipped and held gets a bend on only 10.0% of runs. The second bend finds 92.3% of those, but it is measured, not part of the verdict.
No bend found is not the same as healthy.
A creative at low or flat exposure, or too young, has no bend to find, and the method correctly steps down or stays silent. The failure comes when a dashboard reads "no fatigue found" as "healthy". The thirty-one real campaigns that never passed 3.3 impressions per person are that case: wear-out was not yet testable.
Below the volume floor the answer is silence, not "healthy".
With a window under 1,000 impressions, a creative's rate is mostly noise, and the correct output is a refusal. If a tool tells you a low-volume creative shows no fatigue, check whether it means "I looked and found none" or "I could not look". The second is far more common.
Auto-rotated placements cannot be scored this way at all.
Where the platform mixes and rotates assets inside a group (Performance Max, Advantage+), the exposure of one creative cannot be cleanly separated, so there is no axis. A per-asset number in that setting is contaminated, not merely noisy.
This is a screen, not a measurement.
It reads a shape and infers a cause. Only an experiment settles the question: hold the creative constant in a random slice of your audience and compare. This test tells you which two creatives out of forty are worth that experiment.
What the platforms themselves say
Meta names the mechanism, an audience running out [2], and its reporting sets how fine the axis can be: ask for hours and reach comes back as zero [3]. So this method treats exposure as accurate to the day and no finer.
Google's creative-refresh guidance is about the cure, and it is cautious: change only a small share of your assets at a time, so the system can keep performance stable while it learns [11]. The same page expects an asset to have had at least 14 days to ramp up before you judge it [11], which is the practical argument for the fallback rung's settled early window over a first-week one.
And Google's troubleshooting page is, in effect, a list of everything that will impersonate fatigue on your chart [1].
Common questions
Is there an exposure number above which an ad is definitely worn out?
My click-through rate fell off a cliff this week. Is that not obviously fatigue?
Can I run this on conversion rate instead of click-through rate?
I do not have reach. Can I use impressions instead?
The verdict says "wearing out, range only". What does that mean?
Should I just refresh creative on a schedule and skip all this?
Try it on your own ads
Export one creative's daily impressions, clicks and reach to date, from its launch to today. Load the file into the notebook or paste it into the spreadsheet, and look at which rung the verdict lands on before you look at any number. Then, at next Thursday's call, when somebody says the creative is tired, you can tell them whether the people seeing it are tired of it or something else changed, before the designer opens a new file.
References
- [1] Google (n.d.). Troubleshoot performance fluctuations and changes in Google Ads campaigns. Google Ads Help (accessed 7 September 2026).
- [2] Meta (n.d.). Understanding and optimizing your ad campaign. Meta Horizon OS Developers (accessed 7 September 2026).
- [3] Meta (n.d.). Breakdowns. Marketing API, Insights (accessed 7 September 2026).
- [4] Muggeo, V. M. R. (2003). Estimating regression models with unknown break-points. Statistics in Medicine, 22, 3055 to 3071. Cited through the segmented package's reference manual on CRAN (accessed 7 September 2026).
- [5] Maidstone, R., Fearnhead, P. and Letchford, A. (2019). Detecting changes in slope with an L0 penalty. Journal of Computational and Graphical Statistics. arXiv:1701.01672, pages 1, 5 and 6.
- [6] Shaw, C. (2025). A level-aware path signature framework for synthetic screening of fatigue-related advertising performance changes. arXiv:2509.09758, pages 2, 5, 7, 15 and 16.
- [7] Theil, H. (1950). A rank-invariant method of linear and polynomial regression analysis.
- [8] Sen, P. K. (1968). Estimates of the regression coefficient based on Kendall's tau. Journal of the American Statistical Association, 63(324), 1379 to 1389.
- [9] Naples, M. J. (1979). Effective Frequency: The Relationship Between Frequency and Advertising Effectiveness. Association of National Advertisers, pages 80 and 81.
- [10] Chae, I., Bruno, H. A. and Feinberg, F. M. (2019). Wearout or weariness? Measuring potential negative consequences of online ad volume and placement on website visits. Journal of Marketing Research, 56(1), 57 to 75, pages 1, 3, 8 and 11.
- [11] Google (n.d.). Demand Gen creative assets refresh guidance. Google Ads Help (accessed 7 September 2026).
From Stochastic Strata. I build marketing measurement that shows its working: every number carries its range, and when the data cannot answer a question, I say so and tell you what would. The worked example here is synthetic. The method is the real thing, and you can run it on your own data with the notebook or spreadsheet above. Nothing in this post is financial advice.