Search budgets and bids · 20 min read · Interactive · Video
Where am I losing money right now, and can I trust Google's own estimate of the fix? Impression share and a replay of logged auctions
It is Thursday evening, and the search campaign has spent its 200 euros for the day, as it does every day. Its owner opens the bid simulator and finds a promise there. Raise the bid by 30 per cent, take the cap off the budget, and the coming week brings 138.7 conversions. Underneath, in the chat window, one line. "Is that real?"
Two questions hide in that line. Where is this campaign losing money now? And how far can Google's own estimate of the fix be trusted? The first has a good answer already sitting in the account. The second is the one I measured.
The short answer
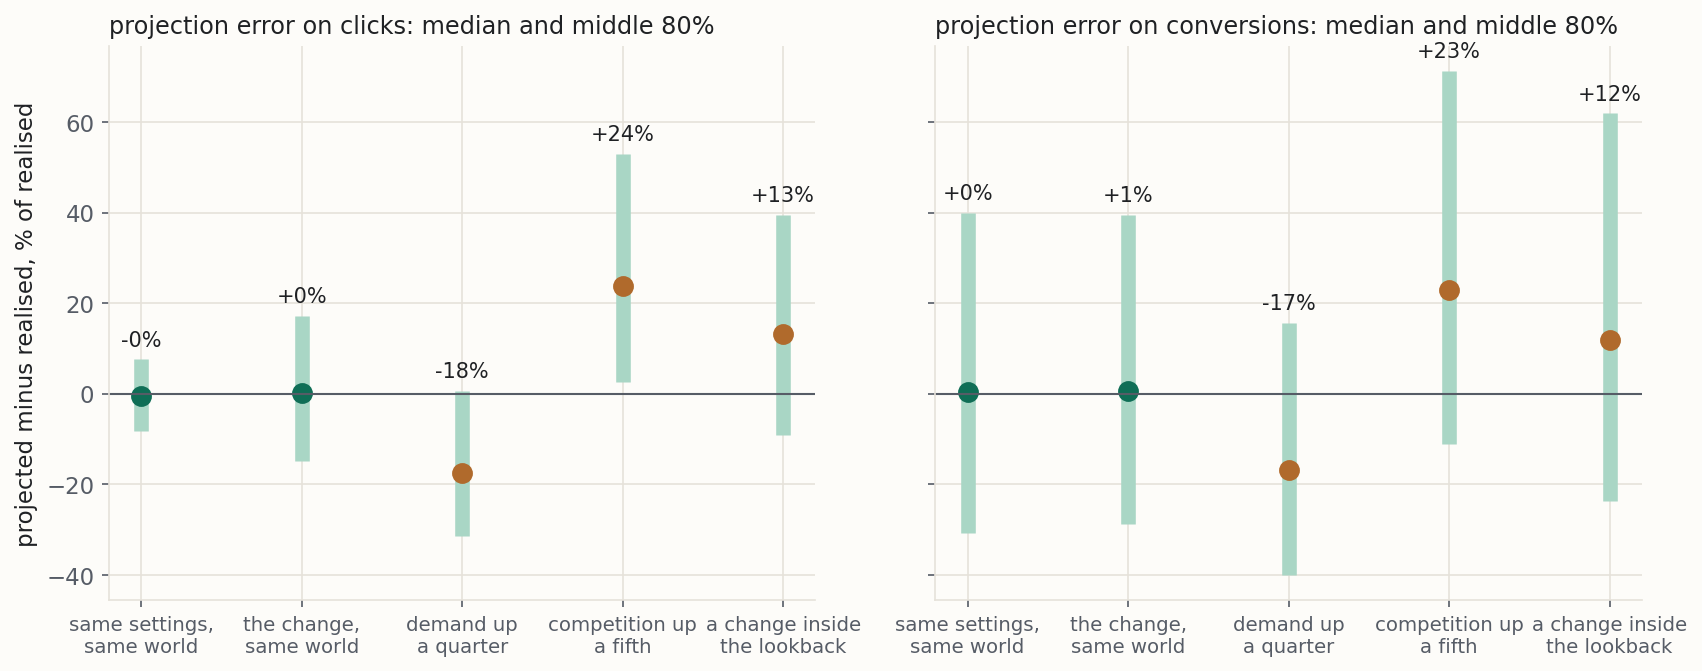
You are losing money in two places, and your account already shows both: the auctions your budget kept you out of, and the auctions you entered and lost on bid. Those shares describe auctions that already happened, so they are the most trustworthy numbers you have. The fix is harder. Simple arithmetic overstates what a bigger budget wins and underprices what higher bids cost. Google's bid and budget simulator estimates the fix by replaying last week's auctions at the new setting, which Bottou and colleagues, writing about Bing's ad auction, call a counterfactual estimate from logged data. In my tests on five hundred synthetic campaigns, such a replay landed within a fifth of the next week's clicks 89 per cent of the time when the world held still. When competition rose a fifth, the typical campaign's click projection overshot by 23.9 per cent. A replay cannot see next week. It assumes everyone else stands still.
What the report already knows
Every time someone types a query your campaign could answer, an auction runs, and one of three things happens. You show, because your bid (weighted by how good Google thinks your ad is) clears the price the others set. You are kept out, because the day's budget is spread thin. Or you enter and lose, outbid.
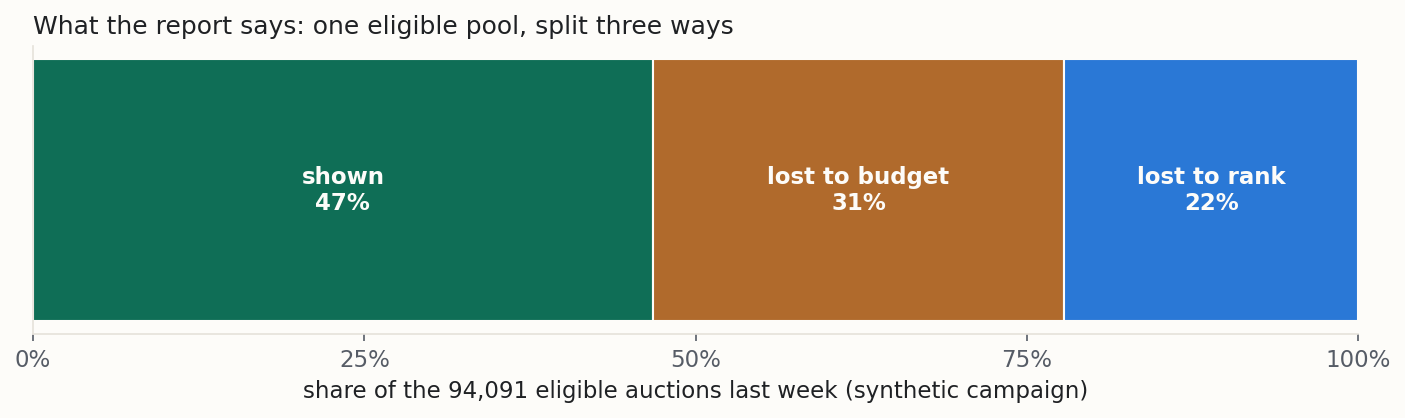
Google reports these as three shares of one pool: impression share, the share lost to budget and the share lost to rank [2, 3]. They add up to the whole, and they describe auctions that already happened.
The catch is that the pool itself is an estimate. It counts auctions you could have shown in at a higher bid (Google's example is twice your current one), and leaves out ones that would have needed something like a 1,000 per cent bid increase [2]. So the share lost to rank means the auctions within reach, and the whole split moves when the bid does.
Think of the pool as a stack of tickets, each with a price on it. The budget decides how many you get to look at, and the bid decides how many of those you can afford. The obvious mistake comes in two halves: assuming the tickets you never saw were all winners (they were a mix, in your usual proportion), and assuming the ones you could not afford would cost what your usual ticket costs. They would not. They are the expensive ones, which is why you lost them.
Which methods this uses, and why not the others
What runs here. Two readings and one experiment. I read the three-way split as the platform reports it, with the arithmetic it supports and nothing more. I relay the platform's own estimate of a change, the bid and budget simulator, as what it is: a projection only Google can check. And I build a replay of the same kind on a campaign I generated auction by auction, so its projection can be held against the week that followed.
The back-of-envelope sum. Multiply the impressions you lost by your usual click rate, conversion rate and value, and call it the money on the table. It takes a minute and gets one thing right for each leak: budget-lost impressions do come at about your usual price, and rank-lost ones are reachable if you bid enough. But it overstates what a bigger budget wins by one over the win share, 1.47 times on the worked campaign below.
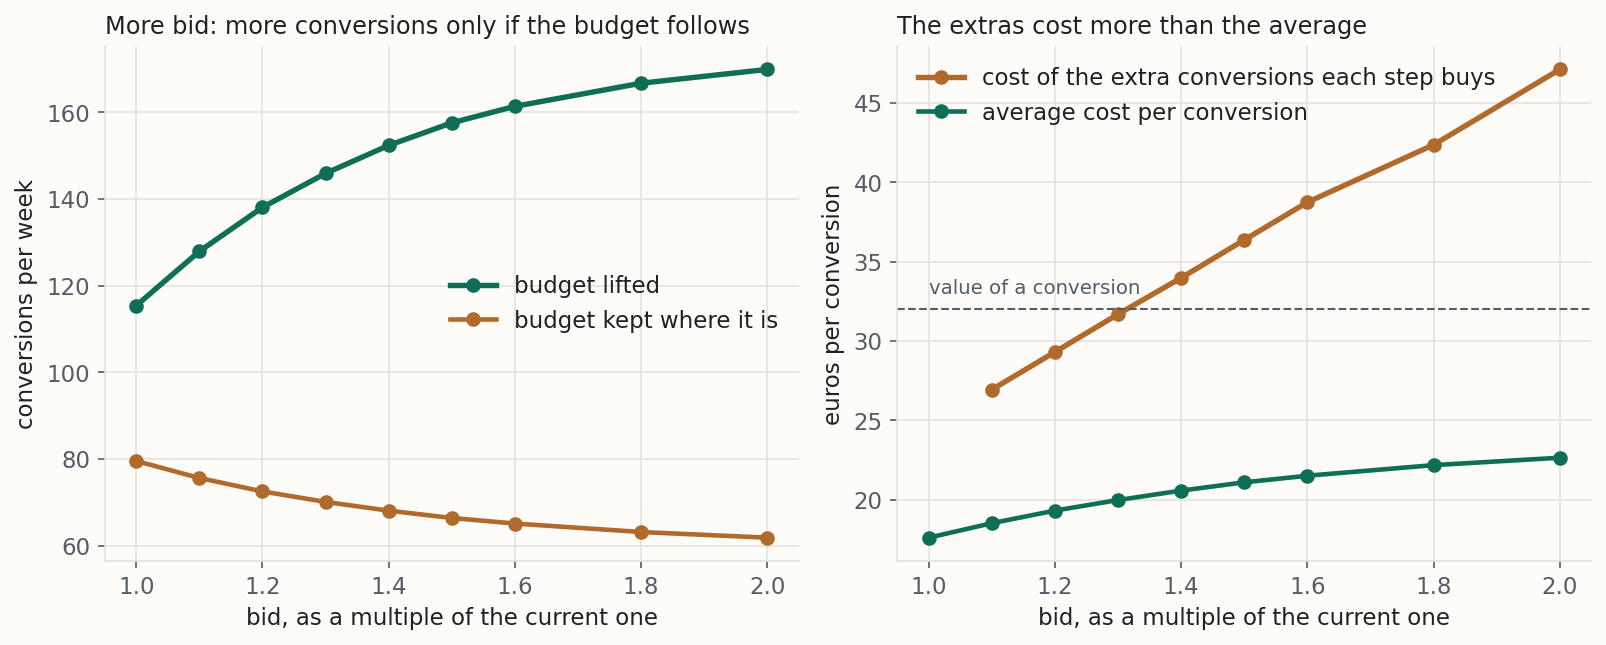
It also gets the price of the rank leak wrong. On that same campaign, the extra conversions from bidding half again as much cost €30.63 each against an average of €17.60.
Google's estimate, read as a forecast. The simulator holds data nobody else has, every competitor's bid in every auction you were in, so I do not try to rebuild it from outside. Its weakness is in the tense. Google's own page says the tools estimate how your ads "might have performed" [1]. The research name for that is a counterfactual on logged data, and Bottou and colleagues set its scope in one phrase: what would have happened "without incurring user or advertiser reactions" [7]. It is last week re-run, with everyone else frozen.
Measuring the change after you make it. A before-and-after comparison (the careful version is called an interrupted time series) tells you what a change did. The split and the simulator tell you, beforehand, where the room is. A good decision puts three things side by side: the headroom the account reports, what the vendor projects, and what happened the last time you moved this lever. None of the three settles it alone.
The formula, written out
Here is the maths, in five short steps. The first four are one division or multiplication each, and after them you can check every figure in this post by hand.
The pool. With I the impressions the platform reports and s the impression share,
E = I ÷ s
is the eligible pool. With b and r the shares lost to budget and to rank, s + b + r = 1, and the auctions lost to each cause are E · b and E · r. On the worked campaign that is 29,234 and 20,860 auctions.
The win share. When the campaign does enter an auction, it wins a fraction of the time, and the report already holds that fraction:
w = s ÷ (s + r)
The win share is 67.8 per cent on the worked campaign.
What a bigger budget wins. If the budget is spread evenly through the week, the auctions it kept you out of are a fair sample of all your auctions. So a bigger budget would have won E · b · w of them, at about your usual click rate, conversion rate and price. That is 19,832 impressions, not 29,234. The even spread is an assumption about the budget, not a law, and the notebook says so.
The naive count and the corrected one. With click rate c and conversion rate v, the naive conversions from a bigger budget are E · b · c · v and the corrected ones E · b · w · c · v, so the naive count is too big by 1 ÷ w. On the worked campaign that is 50.5 naive conversions against 34.3 corrected ones. For the rank leak there is no corrected count without a bid, and no price without the spread of prices to beat, which the report does not carry.
The replay. Take last week's auctions, each with its price to beat t. At a bid m times the current one, the campaign wins every auction with t ≤ m · bid. Clicks are the wins times last week's click rate for that hour, cost is the price to beat of each clicked auction, and conversions are clicks times the week's conversion rate. If the cost goes over the budget, everything shrinks to the share the budget allows. That is the whole engine, and the widget runs the same code. Bottou and colleagues describe exactly this kind of replay of past data, and say where it is weakest: at settings the logged data barely covers, which a careful system leaves out [7]. That is why a simulator shows a band of bids around your current one, not a curve to the horizon.
The worked example synthetic
Every number here comes from the accompanying notebook, which builds the campaign auction by auction (synthetic, built so the right answer is known in advance).
The campaign. One search campaign bidding €1.20 a click on a budget of €200 a day. Prices to beat are stiffer in business hours, when clicks and conversions also peak, and the budget is spread evenly across the week, which makes the three-way split exact.
Each conversion is worth €32 to the business. Last week's report:
| what the report said last week | |
|---|---|
| impressions | 43,997 |
| clicks | 1,782 |
| spend | €1,425 |
| conversions | 76 |
| click rate | 4.05% |
| conversion rate | 4.26% |
| cost per click | €0.80 |
| cost per conversion | €18.75 |
| shown | 46.8% |
| lost to budget | 31.1% |
| lost to rank | 22.2% |
| share of the budget spent | 101.8% |
Three figures for now, and why they differ. The 76 conversions and the €18.75 are what last week happened to deliver. On its own odds, the campaign brings 79.5 conversions a week at its €200 a day, or €17.60 each, and the levers below start from that. Lifting the budget buys more of the same auctions at the same odds, so the price stays at €17.60. It does not get cheaper. The replay further down reads last week's actual log, and gives back 75.0.
Reading the leak. Last week the campaign was eligible for 94,091 auctions, and the budget, not the bid, was the tighter limit.
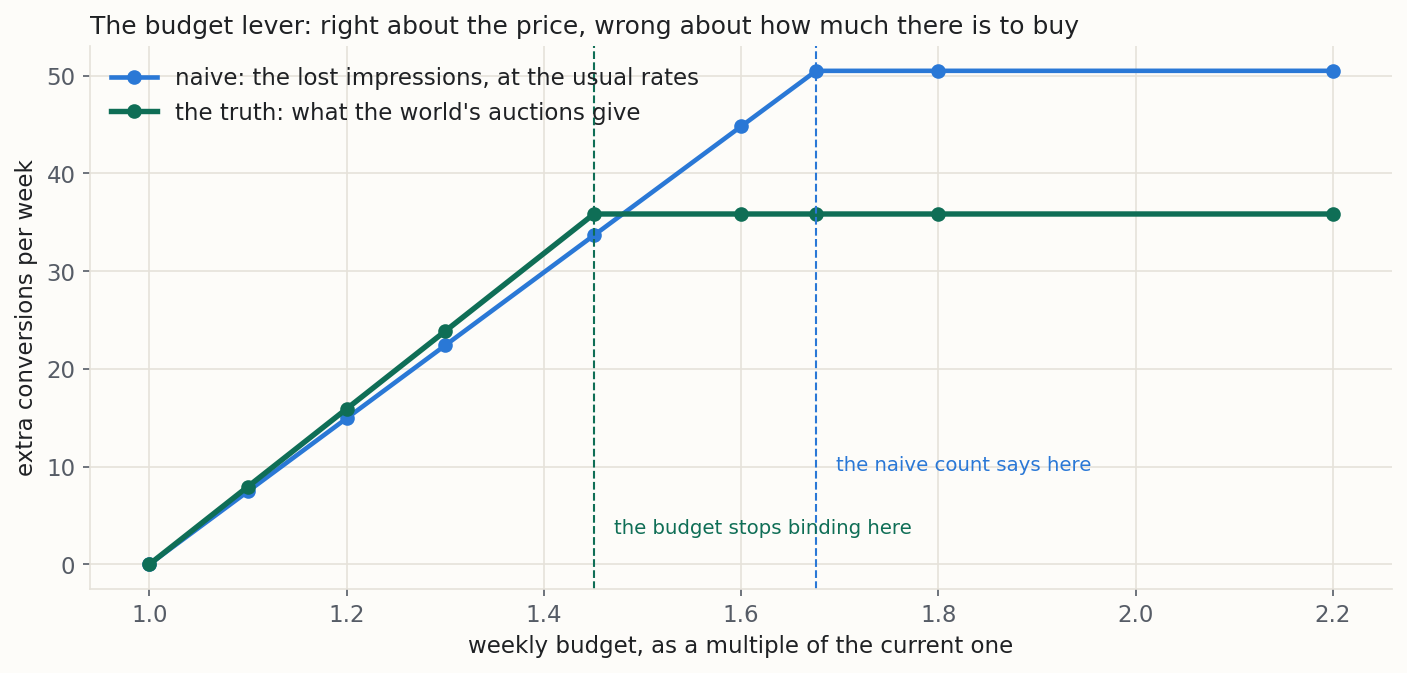
Corrected for the win share, the arithmetic says a bigger budget would bring about 34 conversions here, not the 50 the naive count says. So I tested it. I lifted the budget in the notebook until it stopped binding.
The world's own answer was 35.9 extra conversions, for €631 more spend, at the same cost per conversion as before the lift. The naive count was 1.41 times the truth, and the corrected count was within two conversions of it.
There is a second way the naive count misleads. The budget stops binding at 1.45 times the current one, while the naive count would keep buying until 1.68 times, chasing auctions the campaign would never have won.
| lifting the budget until it stops binding | |
|---|---|
| naive conversions | 50.5 |
| their value at €32 each | €1,616 |
| corrected conversions | 34.3 |
| the truth | 35.9 |
| cost per extra conversion | €17.60 |
The rank leak, priced. Now take the cap off and raise the bid in steps. At half again the bid, the campaign takes 157.6 conversions a week instead of 115.4.
The extra ones cost €30.63 each, or 1.74 times the average. And each step costs more than the one before, so the last steps cost well over twice the average, as the table shows.
At the conversion's value, the extras first cost more than they are worth on the step to 1.4 times the current bid, and the week's margin peaks at 1.3 times, the Thursday setting.
The naive count of the rank leak, 36 conversions at the usual cost, matches the extras at 1.4 times the bid (37.0) and gets the price wrong at every bid.
| raising the bid with the budget lifted | |
|---|---|
| conversions a week at the current bid | 115.4 |
| spend at the current bid | €2,031 |
| cost per conversion at the current bid | €17.60 |
| spend at half again the bid | €3,323 |
| extra conversions at half again the bid | 42.2 |
| extra spend at half again the bid | €1,292 |
| each extra conversion, the step from 1.4 to 1.5 times the bid | €36.36 |
| each extra conversion, the last step to twice the bid | €47.10 |
| margin at 1.3 times the bid | €1,754 |
| margin at the current bid | €1,661 |
| naive rank-leak conversions | 36 |
Why the budget leak is read first. Raise the bid half again and leave the budget at its 200 euros, and the campaign loses 13.1 conversions a week. The same money now buys fewer, dearer clicks. Google says much the same in its own way: a campaign that hit its daily budget recently gets budget ideas instead of the bid simulator, and the rank figure disappears from the ad group view if the budget ran out at any point in the dates you picked [1, 3].
| conversions a week, budget kept at its 200 euros | |
|---|---|
| at the current bid | 79.5 |
| at half again the bid | 66.4 |
The replay, on the week it was built from. Run at last week's own bid and budget, the replay gives back almost exactly the week it read. That is what a replay does.
| the replay at last week's own settings | replay | reported |
|---|---|---|
| impressions | 43,381 | 43,997 |
| clicks | 1,758 | 1,782 |
| spend | €1,400 | €1,425 |
| conversions | 75.0 | 76 |
The replay, against the week that followed. Now the change from the Thursday screenshot: the bid up thirty per cent, the budget lifted so it does not bind. The replay projects 3,252 clicks and 138.7 conversions for the week.
| what the replay projects for the change | |
|---|---|
| projected impressions | 79,712 |
| projected spend | €2,963 |
Then next week happens, in four different worlds.
| next week's world | clicks realised | projection's error on clicks | conversions realised | error on conversions |
|---|---|---|---|---|
| the same world | 3,108 | +4.6 % | 134 | +3.5 % |
| demand up a quarter | 3,858 | −15.7 % | 194 | −28.5 % |
| competition up a fifth | 2,701 | +20.4 % | 123 | +12.8 % |
| a change inside the lookback | 2,643 | +10.7 % | 123 | +2.7 % |
In the same world, the replay is close. When demand rises, it undershoots by the rise it could not see. When competition stiffens, it overshoots, because some auctions it counted as winnable no longer are.
The fourth world is the sly one. Competition rose by a fifth at the start of the fifth day of last week, so the replay read a log that was part old world and part new. It overshot next week by about half as much as the competition world did.
| the week with a change inside it | |
|---|---|
| share of the week before the change | 57% |
| share of the week after it | 43% |
| projected clicks | 2,927 |
| shown, lost to budget, lost to rank | 46.2%, 21.6%, 32.3% |
Scored on five hundred campaigns. One campaign is an anecdote. The notebook builds five hundred, each with its own size, competition, rates, budget and value, and gives every week the small wobble no two real weeks are without. The same change (bid up 30 per cent, budget lifted) is projected from each campaign's last week and scored against its next, as a share of what really happened.
| next week's world | clicks: typical error | middle 80 % of campaigns | within 20 % | conversions: typical error | middle 80 % | within 20 % |
|---|---|---|---|---|---|---|
| same settings, same world | −0.4 % | −8.3 to +7.6 | 98 % | +0.3 % | −30.8 to +39.9 | 57 % |
| the change, same world | +0.3 % | −14.9 to +17.2 | 89 % | +0.6 % | −28.9 to +39.6 | 60 % |
| demand up a quarter | −17.6 % | −31.4 to +0.7 | 58 % | −16.8 % | −40.1 to +15.7 | 49 % |
| competition up a fifth | +23.9 % | +2.6 to +53.0 | 43 % | +23.0 % | −11.2 to +71.3 | 41 % |
| a change inside the lookback | +13.2 % | −9.0 to +39.4 | 61 % | +11.9 % | −23.8 to +61.9 | 45 % |
The first row is the replay doing nothing but predicting next week from last week at the same settings. Its clicks landed within ten per cent on 85 per cent of campaigns. The second row is the change: no lean either way, but wider, because the new bid wins auctions the campaign never entered. In the last three rows the projection stays faithful to a week that no longer exists.
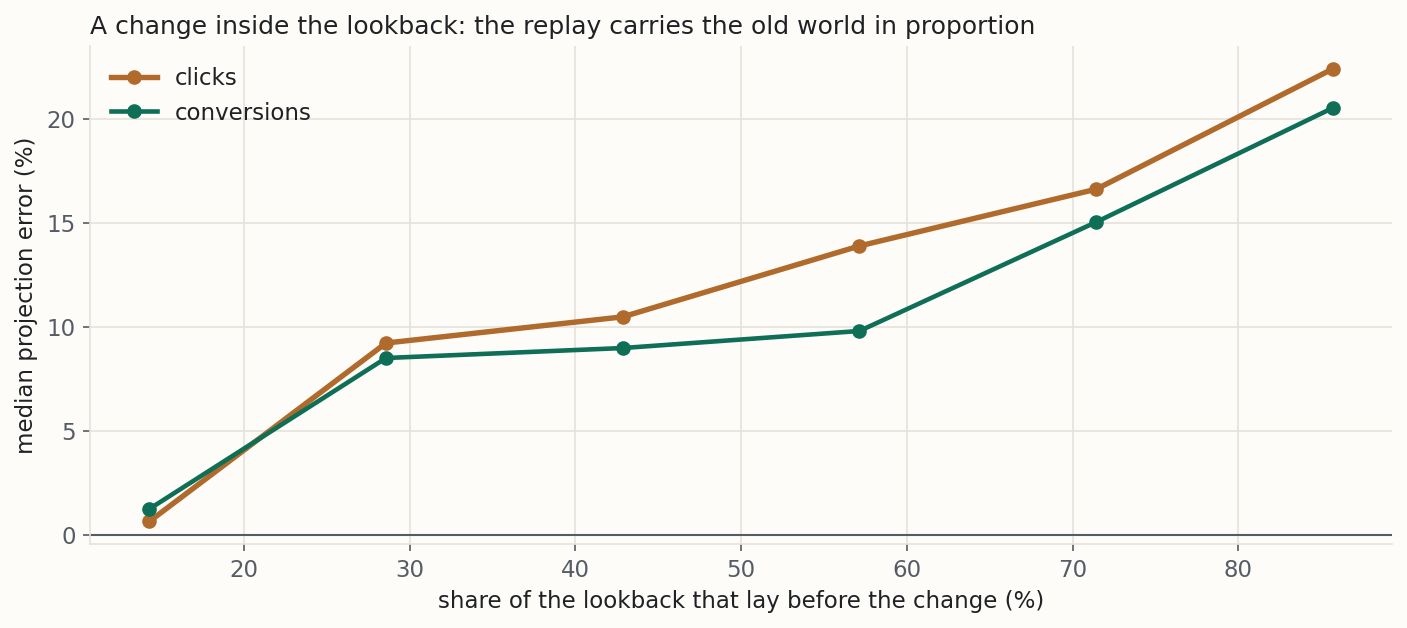
A change inside the lookback, in proportion. The later in the week the change happened, the more of the old world the replay carries. A projection built on a week with a change inside it is wrong in proportion to the share of the week that came before the change, up to 22.4 per cent when six of the seven days came before it.
| share of the lookback before the change | 14% | 29% | 43% | 57% | 71% | 86% |
|---|---|---|---|---|---|---|
| typical click error | +0.6% | +9.2% | +10.5% | +13.9% | +16.6% | +22.4% |
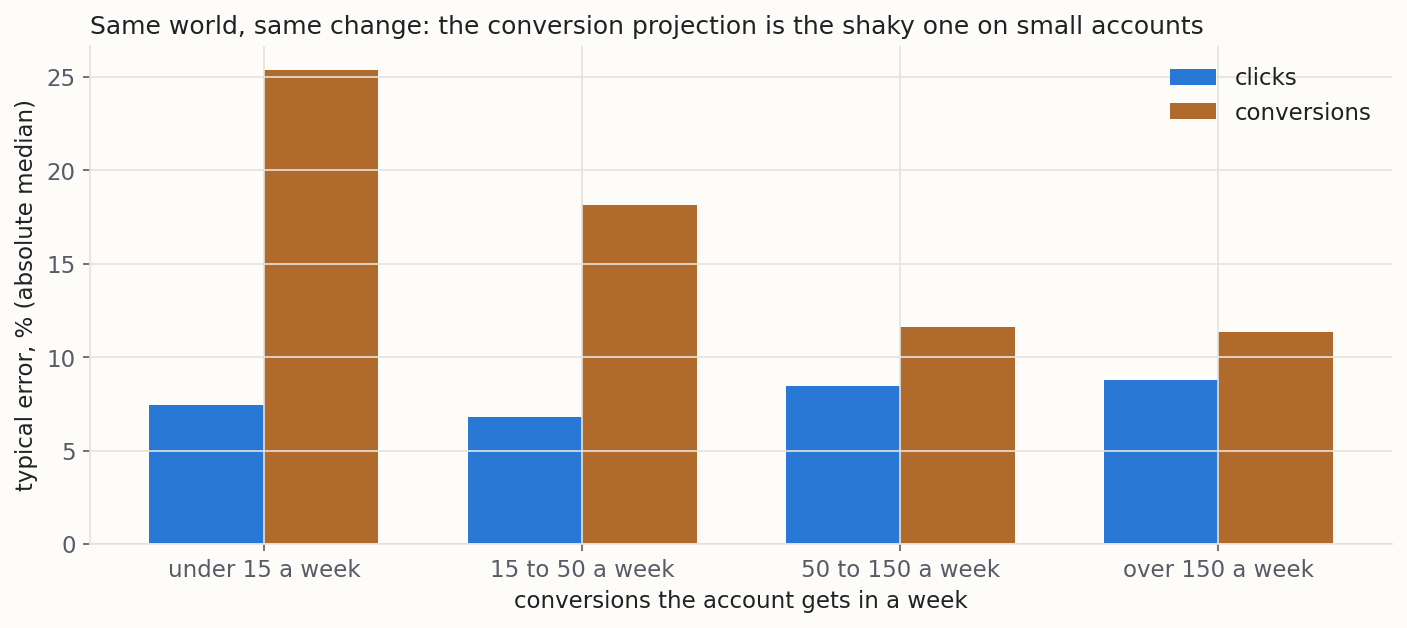
The conversion figure is the shaky one. Clicks are learned from thousands of impressions, and the conversion rate from a few dozen conversions, so the projection inherits every lucky and unlucky week. On campaigns with fewer than fifteen conversions a week, the projected conversions were off by a third or more on 38 per cent of weeks. Google's page puts it mildly: conversions "can be more difficult to estimate" [1]. The table says by how much.
| conversions a week | click miss either way, middle case | conversion miss either way, middle case | conversions off by a third or more |
|---|---|---|---|
| under 15 | 7.4% | 25.4% | 38% |
| 15 to 50 | 6.8% | 18.2% | 26% |
| 50 to 150 | 8.5% | 11.6% | 7.6% |
| over 150 | 8.8% | 11.3% | 3.2% |
What to do with the estimate
Read the leak before the estimate. The split is exact for what it counts. Fix the budget leak first, because while the budget binds, the rank figure is understated and a bid rise buys nothing.
Treat the projection as a look back, not ahead. It says what last week would have brought at the new setting. If a seasonal event, a competitor's move or a change of your own sits between the lookback and the week ahead, the projection is wrong by about the size of the move. Check the simulation's dates against your change history first.
Trust its clicks before its conversions. The click projection is the sturdy one. On an account with fewer than fifty conversions a week, read the conversion figure as a range at least a fifth wide either way: the middle miss there was 20.0 per cent.
Keep a log, and let it earn trust. Every time you act on a projection, write down what it promised and what happened over a window of the same length. On the synthetic campaigns' own errors, the typical click error is known to within ten points either way after 8 logged changes, and the typical conversion error after 30. The notebook refuses a reading below those floors and shows the errors one change at a time instead.
Try it on your own numbers
The synthetic campaign's report and its split sit at the top. Below them, a replay of last week's auctions projects what a different bid or budget would have brought, and beside it is what next week's auctions actually hold in a world you choose: the same world, demand up, competition up, or a change inside the lookback. Move the bid and the budget and watch where the projection is honest and where it carries last week into a week that no longer exists. The pinned cases are the ones the notebook stores, and the widget reproduces all of them with the same code and says so at the bottom.
Caveats to watch out for
Every method has conditions it needs. These are this one's, and they are the part of the post worth reading twice.
The eligible pool is an estimate that moves with your bid.
Google counts as eligible the auctions you could have shown in at a higher bid, its example being twice your current one [2], so raising the bid changes the pool the shares are measured against. My synthetic campaign draws the line at four times the bid. The arithmetic of the split is the same wherever the line sits.
A capped budget hides the rank leak.
While the budget binds, the share lost to rank is measured only on the auctions the campaign entered, so it understates how often it is outbid. A bid rise under the cap cost the worked campaign 13.1 conversions a week. Google withholds the rank figure at ad group level in exactly this case [3]. Lift the budget, let the shares settle, then read the rank leak.
The clamp bites where the leak is biggest.
The platform reports a lost share above ninety per cent as a ceiling and an impression share below ten per cent as a floor [4]. The campaign in the notebook whose true budget-lost share was 94.2 per cent arrives as 90.01. The room behind it is at least what is shown, and the notebook reads it that way.
A bigger budget buys your usual share of the lost auctions, not all of them.
The naive count of the budget leak is too big by one over the win share: 1.47 times on the worked campaign, and 1.41 against the world's own answer. The correction assumes the budget is spread evenly across the week. Where a real budget runs out at a fixed hour, the auctions it misses are that hour's, and the correction is only approximate.
The rank-lost conversions are priced above your average, by construction.
The auctions you lose on rank are the ones whose price to beat is above your bid, and winning them means paying it. On the worked campaign the extras from half again the bid cost 1.74 times the average. No report shows the spread of prices behind that. Only a bid change does.
A replay describes last week, with everyone else frozen.
On a typical campaign it ran −17.6 per cent on clicks when demand rose by a quarter and +23.9 when competition rose by a fifth. It cannot see next week, and it says nothing about whether anyone else will move.
A change inside the lookback is carried in proportion.
With a change inside the lookback, the typical click projection ran +13.2 per cent high. With most of the week before the change, it reached 22.4 per cent. Check the simulation's start and end dates against your change history before reading the number.
The conversion projection inherits a week's luck.
On campaigns with fewer than fifteen conversions a week, it missed by a third or more on 38 per cent of weeks, while the click projection's typical miss was 7.4 per cent. Google says the conversion estimate is harder and improves with more history and more conversions [1].
A handful of logged changes proves nothing.
The typical error from three changes is mostly luck. It takes 8 changes for clicks and 30 for conversions before the middle ninety per cent of typical errors spans less than twenty points.
Bids far from the one you ran are the weakest region.
Last week's data holds few auctions that speak for a bid twice the current one, and a careful counterfactual system leaves such settings out rather than print a number [7]. My widget goes to twice the bid only because the synthetic log is complete.
These numbers are from synthetic data.
Every auction and every week was generated with the answer built in, so each reading could be scored. Yours has a different shape. The method transfers, the numbers do not.
Getting your data
A campaign export, one line per day. In the Google Ads interface, on the Campaigns page, add the columns Search impr. share, Search lost IS (budget) and Search lost IS (rank) next to impressions, clicks, cost and conversions. Segment by day, filter to one campaign (a brand campaign's shares say nothing about a generic one's) and download as CSV. The notebook reads that download as it comes, title lines, percentages, Total row, European decimals and .xlsx included, or a tidy file with these columns:
| column | what it holds | example |
|---|---|---|
date | the day | 2026-08-03 |
impressions | impressions that day | 4988 |
clicks | clicks | 182 |
cost | spend, in your currency | 149.20 |
conversions | conversions | 7 |
search_impression_share | impression share, as a fraction or a percentage | 0.43 or 43% |
search_budget_lost_impression_share | share lost to budget | 0.28 |
search_rank_lost_impression_share | share lost to rank | 0.29 |
daily_budget | optional: the average daily budget that day | 150 |
From the API, the same rows come from the campaign resource segmented by date, and the give-to-your-AI brief carries the query. The platform clamps the ends of its scale: < 10% or > 90% in the interface, 0.0999 or 0.9001 from the API, where a lost share is reported between 0 and 0.9 and anything above 0.9 comes back as 0.9001 [4]. The notebook reads each one as the limit it is, so > 90% means at least ninety per cent.
A projection log, one line per change you acted on, kept by hand. Write the simulator's projected clicks and conversions down before you apply the change, because they are gone once it is live.
| column | what it holds | example |
|---|---|---|
change_date | the day the change went live | 2026-07-14 |
what_changed | a note: bid, budget, target | budget 150 to 220 |
projected_clicks | what the simulator projected for the window after | 1620 |
projected_conversions | its projected conversions | 64 |
actual_clicks | what happened in a window the same length as the simulator's | 1544 |
actual_conversions | actual conversions in that window | 51 |
change_in_lookback | optional: yes if something else changed in the week before the projection | no |
What it refuses. Fewer than seven days with an impression share, because the shares swing with the weekday and arrive a day or two late. A file without the three share columns. A trust reading from a log below the floors. It warns, rather than refuses, when a share arrives clamped, when the shares do not add up, and when a logged change had another change inside its lookback.
The notebook runs on your own computer. Nothing about your account leaves it.
The same numbers, in production
The split is the platform's own instrument, and I read it by the platform's own definitions: impression share is impressions over the total eligible, and the two lost shares are the time your ads did not show because the budget was too low or the Ad Rank too poor [2, 3]. Google's Limited by budget status fires on that split, when a campaign misses 5 per cent or more of its potential traffic in a week [5, 6]. The simulators are the platform's own too, built from auction data including Quality Score and competition over the last 7 days [1]. The engineering behind such an estimate is public: the team running Bing's ad auction described estimating, from logged auctions, how the system would have done with one auction setting scaled, every user and advertiser frozen [7]. It is the same scope I measured, with the same limit at settings the data never ran.
Common questions
My campaign says "limited by budget". Should I raise the budget?
Should I raise bids instead?
Is the bid simulator accurate?
Why is its conversion number so far off when the clicks are close?
What does "lost IS (rank)" actually mean for my money?
The shares don't add up to a hundred. Is the export broken?
Can I skip all this and just follow the recommendations tab?
Try it on your own account
Export the last thirty days of one search campaign, one line per day, with the three share columns. Work out the pool, the win share and the corrected count for a bigger budget, and set it beside what the simulator offers. Then write the simulator's promise down before you press apply. Next Thursday, when the chat window asks whether it is real, you will have a week of your own to answer with.
References
- [1] Google Ads Help. Estimate your results with bid, budget, and target simulators. Google. support.google.com/google-ads/answer/2470105 (accessed 15 September 2026).
- [2] Google Ads Help. About impression share. Google. support.google.com/google-ads/answer/2497703 (accessed 15 September 2026).
- [3] Google Ads Help. Get impression share data. Google. support.google.com/google-ads/answer/7103314 (accessed 15 September 2026).
- [4] Google Ads API. Metrics field reference, version 24, the search impression share and search budget lost impression share fields. Google for Developers. developers.google.com/google-ads/api/fields/v24/metrics (accessed 15 September 2026).
- [5] Google Ads Help. Fix "Limited by budget" bid adjustments. Google. support.google.com/google-ads/answer/2616012 (accessed 15 September 2026).
- [6] Google Ads Help. About budget pacing insights. Google. support.google.com/google-ads/answer/13685469 (accessed 15 September 2026).
- [7] Bottou, L., Peters, J., Quiñonero-Candela, J., Charles, D. X., Chickering, D. M., Portugaly, E., Ray, D., Simard, P. and Snelson, E. (2013). Counterfactual reasoning and learning systems: the example of computational advertising. Journal of Machine Learning Research, 14, 3207 to 3260, pages 3221 to 3227.
From Stochastic Strata. I build marketing measurement that shows its working: every number carries its range, and when the data cannot answer a question, I say so and tell you what would. The worked example here is synthetic. The method is the real thing, and you can run it on your own data with the notebook or spreadsheet above. Nothing in this post is financial advice.