Anomaly detection · 19 min read · Interactive · Video
Something moved. Is it a blip, a trend, or a broken thing? A median score, the Theil-Sen slope and change-point detection
Conversions are down, cost per acquisition is up, and somebody wants to know if it is a problem. I show how to tell one bad day from a slow slide or a step to a new level, how big each must be before your data can show it, and why the alarm line is a budget you choose.
It is Thursday, not long after nine. Somebody has dropped a chart into the team channel: conversions down this week, cost per acquisition up, and a red circle drawn by hand round the last few days. Underneath, one line. "Is this a problem?"
It is a fair question. It is also three questions wearing one coat, and the red circle sits on the one stretch of the chart that cannot answer any of them.
The short answer
It could be any of the three, and only three separate tests can tell them apart, because each shape hides from the others' arithmetic. A blip is one bad day, a trend is a slow slide where no day looks wrong, and a break is a step to a new level that stays. I use a one-day score built on the median, a slope taken as the median of every pairwise slope (Theil's 1950 estimator), and a search for the day the level changed (the change-point method of Killick, Fearnhead and Eckley). In my tests a step was caught half the time at about 13% above normal, while a single bad day had to reach about 95%. The method cannot score the newest days of a conversion metric. Still filling in, they set off the day test 62.7% of the time with nothing wrong.
Which methods this uses, and why not the others
I run three detectors, one per question. For single bad days, a one-day score built on the median of the last four weeks and on how far days usually stray from it (statisticians call that spread the median absolute deviation, or MAD). For slow slides, the slope of the last four weeks taken as the median of every pairwise slope, scored against the slopes that metric usually produces. For steps, an exact search that asks whether the series is better described as one level or as two, which the literature calls change-point detection.
Three other approaches are common, and each beats mine at something.
Week-on-week percent change. Most accounts run on it. It is instant, needs only last week and never needs explaining. But it has no idea how much this metric normally wobbles, so on a low-volume metric it fires every week, and on a high-volume one a real step can hide inside the ordinary swing. It answers "did the number move?" when the question is "did it move more than it usually does?"
The textbook control chart, which draws its line from the mean and the standard deviation of a recent window. It is one line of arithmetic, and on clean history it is genuinely good: measured at equal false-alarm cost, it beat my median-based score on a clean series. The trouble is that the spikes you are hunting live in the history you measure against, and one of them is enough to bend the yardstick. Real accounts have ordinary data glitches, and then the advantage reverses.
A forecast, with an alarm when reality misses it. It handles yearly seasons, holidays and curved trends, none of which a four-week window can see. But it tells you what should happen next, not whether something broke, and a model trained through a break quietly absorbs it. When the picture is a slope rather than a staircase, the forecast is the right tool and mine is not.
The question underneath
Three shapes, three meanings, three different actions.
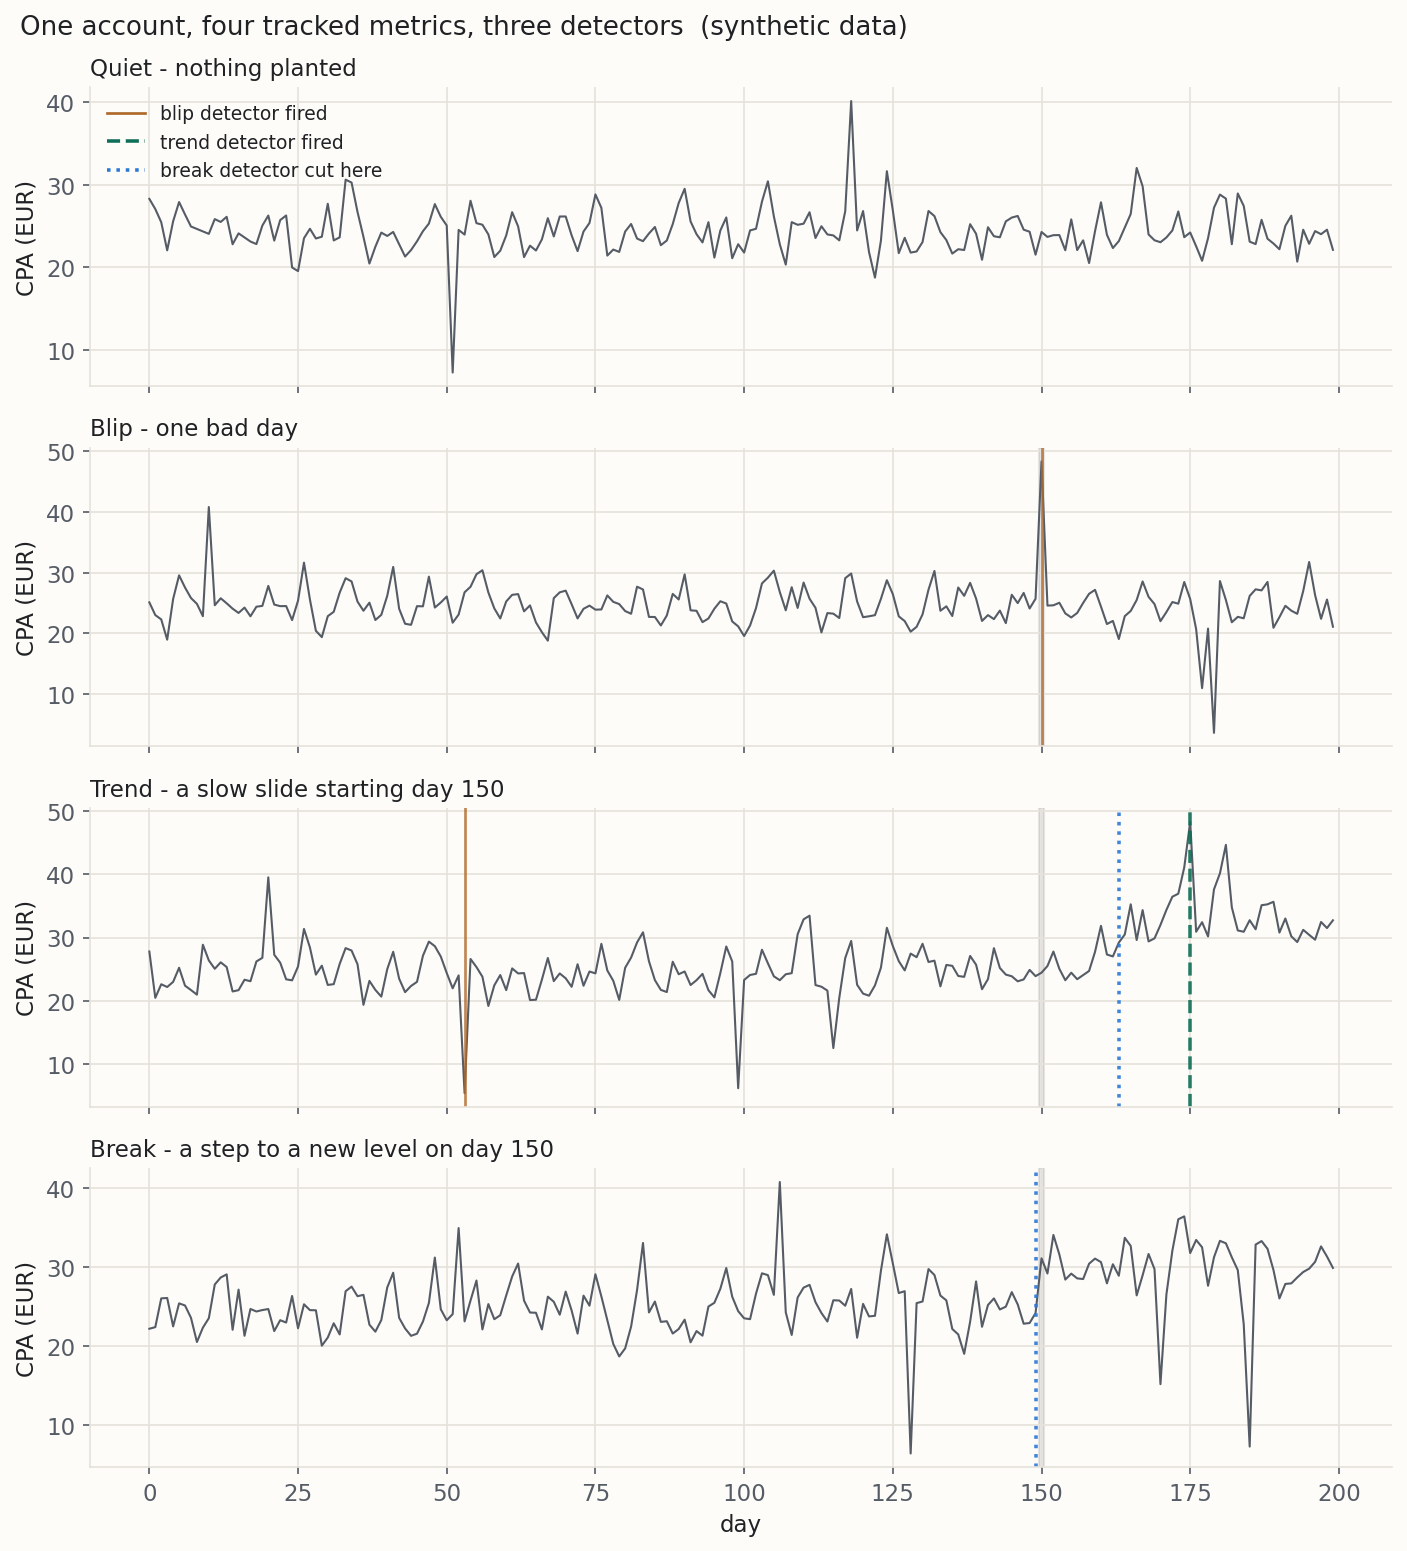
A blip is a day. Something odd happened on Tuesday and it is over. The right response is usually to write it down and do nothing, because acting on a blip means changing a bid because of noise.
A trend is a direction. Nothing was ever wrong on any particular day, which is exactly why it goes unnoticed until a monthly report shows it, a month late.
A break is a level. On Thursday the number was one thing, on Friday another, and it stayed there. It is usually somebody's fault and usually fixable, which makes it the most valuable of the three to find quickly.
Each is invisible to the others' arithmetic. A one-day score compares today with a recent window, and a slide drags the window along with it. A slope averages across four weeks, so one spectacular Tuesday barely moves it. A change-point search looks for the day the level jumped. A slow ramp has no such day.
Three detectors, written out
Here is the maths in this post: three formulas, one per detector, each a line long.
The one-day score
Take the last four weeks, remove the weekday rhythm and the local slope, and ask how far today's leftover sits from the middle of the leftovers.
Zrobust = 0.6745 × ( xtoday − median(r) ) ÷ MAD(r)
- xtoday: today's leftover (the residual), after the weekday rhythm and the local slope are taken out.
- r: the leftovers of the baseline days, which are the four weeks before today.
- median(r): the middle leftover, a stand-in for the average that one wild day cannot drag.
- MAD(r): median absolute deviation, the median of the distances from each leftover to that middle.
- 0.6745: a scaling constant that puts the score on the scale of an ordinary z-score when the leftovers are bell-shaped.
Four weeks is not folklore. It is the shortest window in which every weekday appears four times, so a Monday is judged against four other Mondays rather than against a weekend.
Today is left out of its own baseline. Everything is fitted on the four weeks ending yesterday. Include today and a genuinely large spike drags its own yardstick towards itself and scores lower than it should. The detector in my own platform does not do this yet, so a real jump reads smaller there than it is. Leaving today out has a price: the spread has to be calibrated on days the window did not see, which is why the notebook sets its alarm line on quiet data.
Why the median. The standard argument is about how much of the data can go bad before an estimate does, which statisticians call its breakdown point. For the mean the answer is none. One infinite day makes the mean infinite, so, as Leys and colleagues put it,"the mean's breakdown point is 0" [1]. The median survives until just under half the data has gone bad, a breakdown point of 0.5 and the highest any estimate can have [2]. Just under half your history can be garbage and the middle still sits among the real days.
That argument is correct, and it is not the whole story. A later section tests it, and the answer comes with a condition.
The slope
A slow slide never produces a bad day, so score the direction instead.
slope = median of ( yj − yi ) ÷ ( j − i ), over every pair of days i < j
That is the median of every slope between two days in the window, the estimator Theil introduced in 1950 [3]. One freak day changes one term inside a median and nothing else, where a least-squares line tilts to chase it.
A slope means nothing until you know what slopes this metric usually produces, so today's four-week slope is scored against recent four-week slopes, in the same median-and-spread form. My platform's version goes further. On a metric with a deep weekly trough it pairs only days a whole number of weeks apart, and it compares today's slope with past slopes that ended on the same weekday, so the day the window ends on cannot move the score.
Why a size and not a p-value. A significance test on the trend assumes the days are independent draws. They are not, because a good day tends to be followed by another good day. Hirsch and Slack studied exactly this in seasonal water-quality records and found that even when neighbouring months are correlated as weakly as 0.2, the test reports trends that are not there at a rate "substantially higher than α" [4], the rate it promises. Their own fix holds only below a correlation of 0.6 and over records of ten years or more. A marketing series has neither. A p-value computed there is a number with a decimal point and no guarantee behind it.
The step
A step asks whether the series is better described as one level, or as two levels with a boundary between them. That has an exact answer. Score each way of cutting the series by how badly each stretch is described by its own average, and charge a penalty per cut so the search cannot cheat by cutting everywhere.
minimise Σ C( each stretch ) + β × k
- each stretch: the days between one boundary and the next.
- C( · ): the cost of describing one stretch with a single level (here, its sum of squared deviations).
- β: the penalty charged per boundary. Higher means only large steps are worth a cut.
- k: how many boundaries the cutting uses.
Done naively that is an enormous search. A pruning rule makes it practical: once a candidate boundary is provably worse than the best path so far, it can never become the best, so it leaves the search for good. The result is exact, and the whole thing is about twenty lines of code. Its authors, Killick, Fearnhead and Eckley, call it PELT [5].
One assumption, stated by those authors. The cost treats the days inside a stretch as independent draws. The paper remarks that "extensions to dependence within a segment is trivial" [5] and then does not carry them out. Neither do I. Marketing days are not independent, so a series that is stable but wanders gets chopped into stretches that are not really there. I pay for the assumption in the penalty instead, and show you the bill.
The newest days are the emptiest
Back to the red circle on Thursday's chart. This is the largest source of false alarms there is, and almost nobody allows for it.
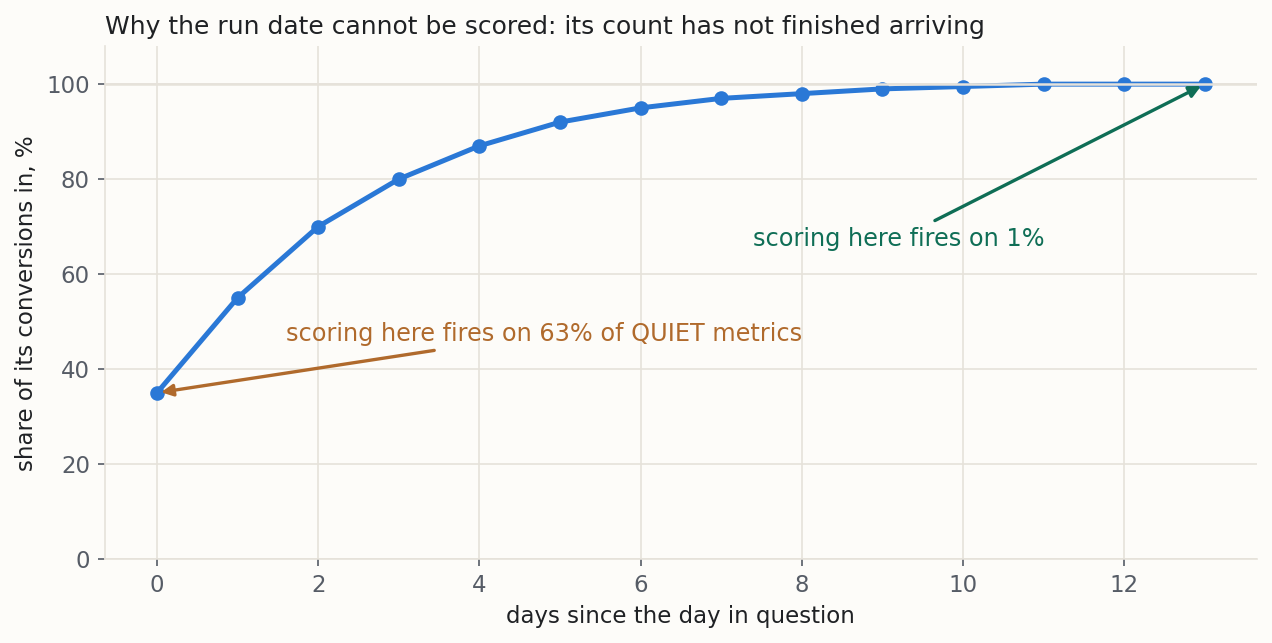
Conversions arrive late. Somebody clicks today and converts on Thursday, so the count attached to today keeps rising for days. Cost is complete at once. So a cost per acquisition worked out on the day is cost divided by a conversion count that has not finished arriving. It reads high. It reads high every single day.
A detector comparing that with four weeks of finished days does not find a problem. It finds the calendar. And because the distortion always points the bad way, it fires the bad way every time: constant, one-directional and completely fake.
To size it, I took the same quiet metrics as everywhere else in this post (nothing planted, nothing wrong) and applied an ordinary reporting curve to the last fortnight. About a third of a day's conversions are in on the day itself, most by the end of the week, effectively all after two weeks. Scored on the newest day, the day test fired on 62.7% of those metrics. Without the lag it fired on 0.7%.
The table below has a control row that runs a curve distorting nothing through the same code. It reproduces the no-lag row exactly, so whatever the lag row shows is the curve and not the machinery. And all three tests are hit. "Watch the level, not the day" does not make the level tests immune: on these metrics the level search was the worst affected of the three.
Nothing happened in any of those metrics. Yet the median score on the newest day was 13.6, against an alarm line of 12.3 calibrated to fire once per metric per year. The detector is right about the arithmetic, because the number really is high. It is wrong about what the number means, and no calibration fixes that.
The fix is not statistical. It is a rule about which day you are allowed to score. Stop scoring days whose counts have not finished arriving. Scored on the most recent settled day instead, the same lagged metrics land back where the calibration promised on the day and slope tests, and the level search falls from 99.3 to 3.3 per cent.
The price is the wait: on this curve, a window about a fortnight old, which is a fortnight of blindness for all three tests. That is a second, quieter argument for watching the level. A step is still there when the window matures. A single bad day is not.
How long your account takes to settle has its own post in this series, the one about why today's numbers always look bad. It fits a survival curve to your click-to-conversion times and reports the share reported by day N, which is exactly the curve assumed here. Do not guess it. Measure it.
| Which day the tests score | Day test | Slope test | Level search |
|---|---|---|---|
| The run date, no reporting lag | 0.7% | 0.0% | 0.7% |
| A flat curve (the control) | 0.7% | 0.0% | 0.7% |
| The run date, with the lag | 62.7% | 30.0% | 99.3% |
| A window that has settled instead | 0.7% | 0.0% | 3.3% |
The line is a budget, not a constant
Here is where most write-ups quietly cheat. They pick a threshold that sounds authoritative, usually three standard deviations, run their favourite detector against a rival, and report that theirs caught more. Of course it did. A detector set to fire more easily catches more of everything, including nothing.
So before any comparison, I calibrated every detector on metrics where nothing was planted, until they all cost the same in false alarms. Over 43,000 quiet metric-days, at one false alarm per metric per year, the one-day scores landed nowhere near where a textbook would put them.
That was the first surprise. A score built from twenty-eight numbers is not a bell-curve score. Its spread is itself worked out from twenty-eight numbers, so it wobbles, and a ratio with a wobbling denominator throws up extreme values far more often than the "three sigma" reflex expects. You can model that (my platform reads its score through a fitted law with heavier tails), but on lopsided metrics even a fitted law lands off. Measure the line on your own quiet data.
And the line is a choice, because its cost depends on how much you are watching. A tracked metric is one number you follow day by day, such as one campaign's cost per acquisition. A few per platform, across the campaigns that matter, and 20 is an ordinary account.
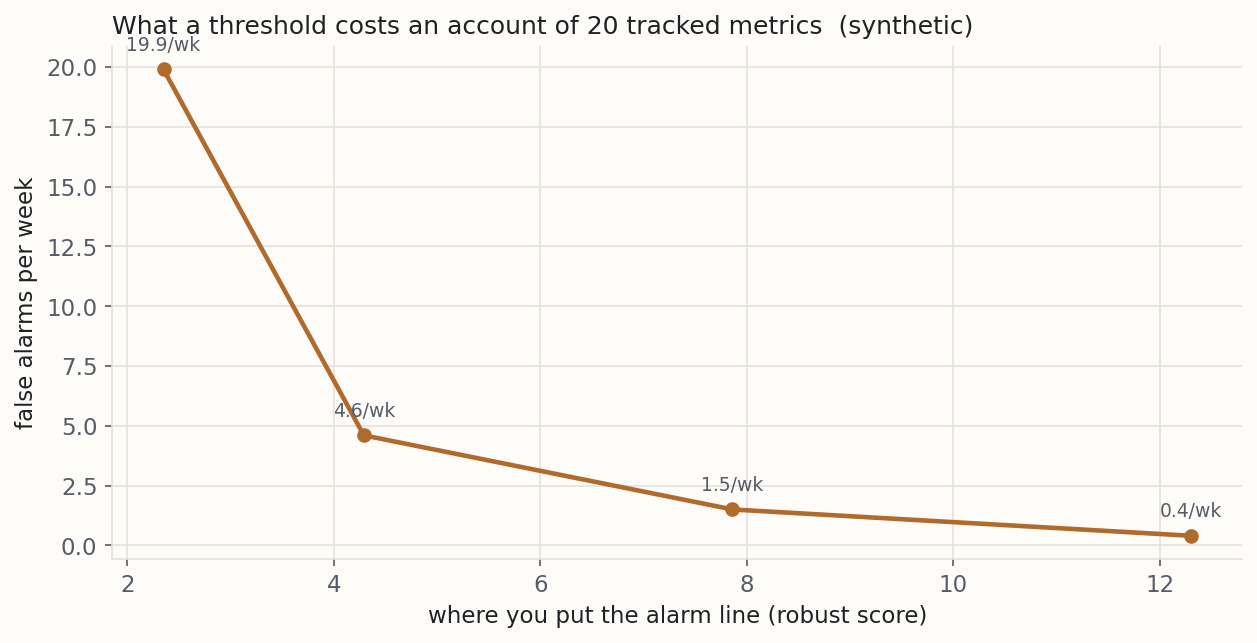
Take the loosest line in the table, one that fires once a week per metric. It sounds conservative. Across an ordinary account it produces about 20 false alarms a week, and only about one day in 22 comes back completely quiet. It is the same arithmetic as scanning a breakdown table for the biggest gap: doing it once is a fair question, doing it all day is a search.
So decide how many false alarms a week your team will actually investigate, and read the line off that. There is no other honest way to set it.
| False alarms per tracked metric per year | Score line | False alarms per week across 20 tracked metrics | Chance of a completely quiet day |
|---|---|---|---|
| 52 | 2.35 | 19.9 | 4.6% |
| 12 | 4.29 | 4.6 | 51.2% |
| 4 | 7.86 | 1.5 | 80.2% |
| 1 | 12.30 | 0.4 | 94.7% |
How big does it have to be?
Which detector is best matters less than one plain question: how large does a change have to be before my own data can show it to me? That depends on your account (how noisy it is, how many metrics you track) more than on the method.
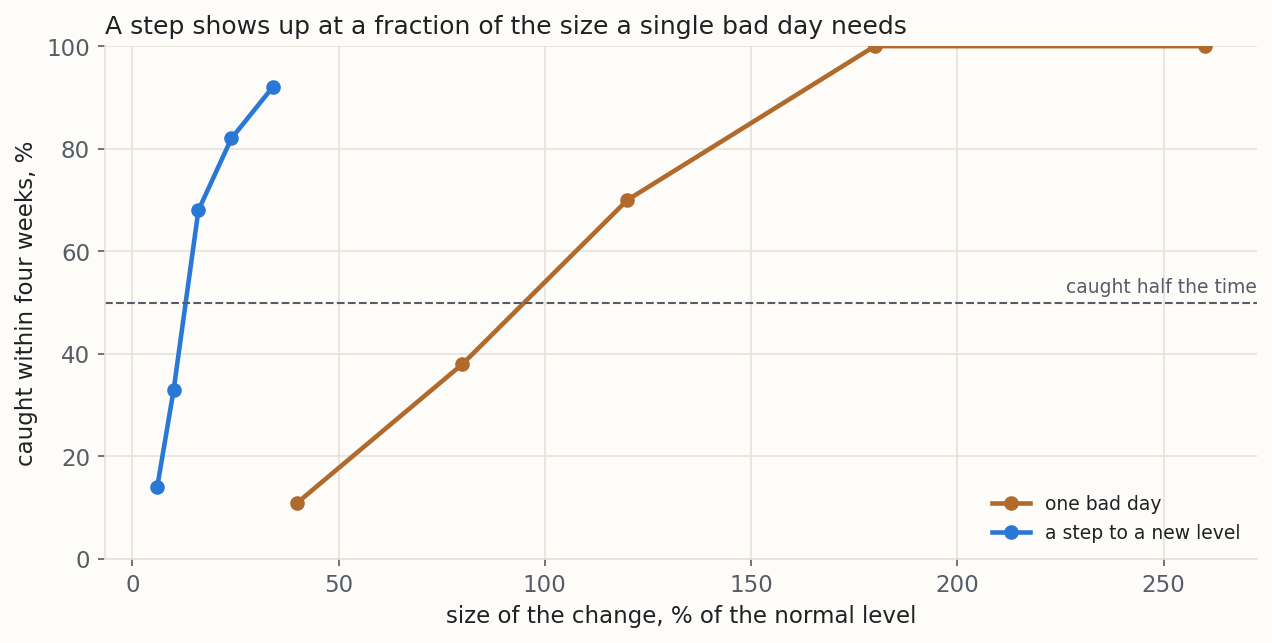
I held the false-alarm budget fixed and varied the size of the planted change. A step to a new level was caught half the time at about +13%. A single bad day had to reach about +95%.
In euros, on an example account (synthetic, built so the right answer is known in advance) whose normal cost per acquisition is €24, a single bad day has to reach about €47 to be caught half the time. A step gets the same odds at €27.
That gap is the practical finding of this post. The change that sticks is caught at a seventh of the size: 13 per cent against 95. If you only watch one thing, watch the level, not the day.
Below a certain size, one odd day simply cannot be told apart from the ordinary glitches every account produces. A bad day and a bad day look identical. Telling them apart is a question about causes, and no statistics on a single series will answer it.
| Size of the change | One bad day, caught | A step to a new level, caught |
|---|---|---|
| +6% | 14% | |
| +10% | 33% | |
| +16% | 68% | |
| +24% | 82% | |
| +34% | 92% | |
| +40% | 11% | |
| +80% | 38% | |
| +120% | 70% | |
| +180% | 100% | |
| +260% | 100% |
Every detector against every shape
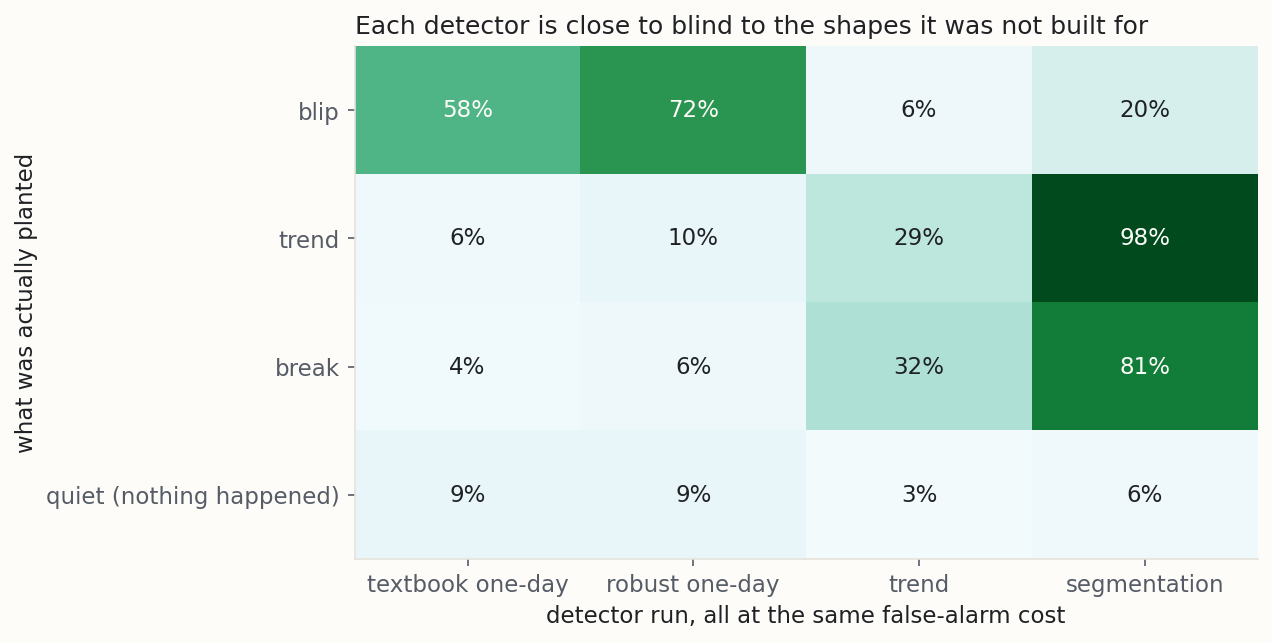
I ran four detectors, all held at the same false-alarm cost, over 180 metrics of each shape. A detector "catches" an event if it fires within four weeks of it. Two things stand out in the grid below.
Each detector is close to blind to the shapes it was not built for. The one-day scores find single bad days and very little else. Run one detector and you answer one of the three questions, whichever one you happened to build.
One number deserves suspicion rather than applause. The step search notices 98% of slow slides, better than the slope does at its own job. It is not being clever. Its only vocabulary is "the level changed on this date", so given a smooth ramp it reports a step, on a date on which nothing in particular happened.
The boundary counts show how it describes a slide. A slide provokes 1.06 boundaries on average against a real step's 0.82, and it reports two or more on 7 slides in a hundred against 5 steps. Mostly it reports one step that never happened. Catching something is not the same as describing it.
In the control row nothing was planted, so every fire is a false alarm, and the rates sit near what the calibration promised: a line set at one false alarm a year per metric fires somewhere in a four-week window on about 7 metrics in a hundred. That floor is also why the one-day scores' 4 to 10 per cent on steps and slides are no catch at all. The step search here is the teaching version. My platform's change-point search clips extreme days before it fits, so a single bad day almost never becomes a boundary, and it marks where regimes change rather than raising alarms (a running-sum detector raises those).
| Planted | Textbook one-day | Median-based one-day | Slope | Step search |
|---|---|---|---|---|
| One bad day | 58% | 72% | 6% | 20% |
| A slow slide | 6% | 10% | 29% | 98% |
| A step | 4% | 6% | 32% | 81% |
| Nothing (control) | 9% | 9% | 3% | 6% |
The case for the median, tested
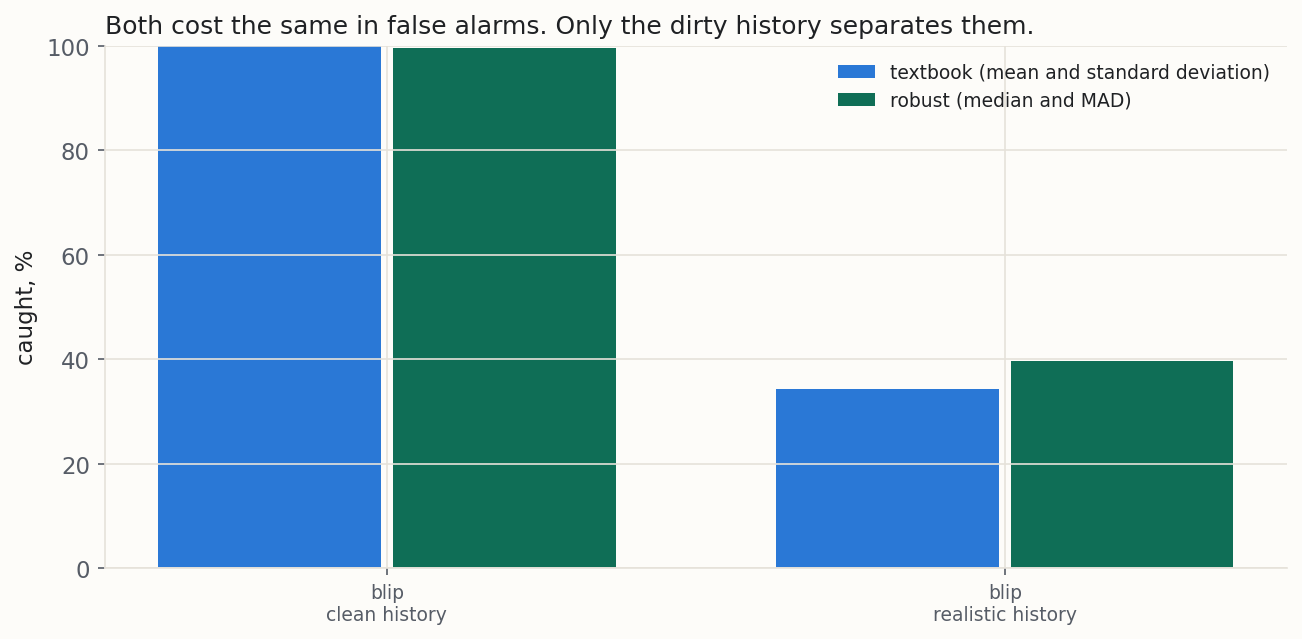
The textbook case for the median, which I made a few sections up, quietly assumes both detectors are held at the same threshold. They should not be. The median-based score throws up extreme values more often, so at a shared threshold it fires more and catches more, at a cost the comparison never shows.
So I calibrated each to the same false-alarm rate and ran them in two worlds. In the clean world the history holds only ordinary noise. In the realistic world about one day in fifty carries a glitch: a billing correction, an hour of bot traffic, a tag that fired twice.
I tested them on single bad days 95 per cent above normal, the size the one-day score catches half the time on realistic history, with 400 metrics in each world. A bigger day is caught by both every time, and a step is missed by both, so neither tells the two apart. On clean history the two tie: the textbook score caught every one, the median-based score 99.5 in a hundred. On dirty history the median-based score pulled ahead, catching 5.5 more in every hundred, give or take 2.7.
So prefer the median for its staying power. On clean data it is no more sensitive than the textbook score. It works better when your history has junk in it, and your history has junk in it.
| World | Median-based minus textbook |
|---|---|
| Clean history | −0.5 points |
| Realistic history | +5.5 points |
A worked example
The numbers below are synthetic, generated with the answer built in, which is the only way to score a reading honestly, since on real data nobody knows which movements were real.
The worked example is one synthetic advertiser, with cost per acquisition per campaign per day. Each campaign gets a weekday rhythm, noise in which each day leans on the one before (a correlation of 0.45 between neighbouring days), and a glitch on about one day in fifty. Then one campaign gets a blip, one a slide, one a step, and one nothing.
The picture is the one the grid predicts. On the quiet campaign, the alarms that fire are glitches: real movements with no business meaning, which is exactly what a false alarm looks like from the inside. The blip is caught on the day it happens, by the one-day score. The step takes the step search six days of the new level when it runs each day on the days seen so far; read back afterwards, it dates the step to the day. The slide is caught late by everyone, a median of fifteen to seventeen days after it begins. The one-day scores are left out of the table for steps and slides: they fire there no more often than on the quiet control, so their delays time false alarms. Run each day, the step search also pays in false alarms: it fires on 14 quiet metrics in a hundred over the four weeks, against 6 when it is read once at the end.
That lateness is not a defect to fix. A slide is, by construction, a change no single day reveals. Waiting is what it costs to see it at all.
| Campaign | Detector | Median delay before it fires |
|---|---|---|
| The blip | One-day score | zero days |
| The step | Step search, run each day | six days |
| The step | Slope | seven and a half days |
| The slide | Step search, run each day | fifteen days |
| The slide | Slope | seventeen days |
Try it on your own numbers
Set the shape, the size of the change and how noisy it is, and watch which of the three detectors notices. Then move the last slider, how many metrics you are tracking, and watch the verdict change without the size of the change moving at all. That last control is the whole argument of this post, and no dashboard has it. The four presets are the cases the notebook pins. The widget reproduces all of them, and says so at the bottom.
Caveats to watch out for
Every method has conditions it needs, and the ones below are the conditions this method needs. They are the part of the post worth reading twice.
On a conversion metric, the freshest days are unusable.
This comes first because it is the largest. Conversions report late and cost does not, so a rate worked out on the day reads bad on every account, every day. With nothing wrong anywhere, scoring the newest window set off the day test on 62.7% of metrics and the level search on 99.3% (the slope test is in the table above). Set aside the days still filling in, and measure how many that is, because it depends on your buying cycle. Spend, impressions and clicks are complete on the day and unaffected.
It cannot tell you why.
Every detector here answers "did the level, the direction or the shape of this series change?" None answers "because of what?" A step on the day you changed bidding strategy and a step on the day a competitor raised theirs are the same picture. Checking detected boundaries against your own change log closes that gap cheaply, and it is a lookup, not a model.
A break inside your comparison window contaminates it.
If a step happened inside the recent window, today is compared with a blend of two levels, and the step itself inflates the spread. The alarm is not wrong (something did move), but its evidence is weaker than the score suggests. It clears as the window refills with days from the new level: four weeks for a one-day alarm, and four weeks for the slope too. The slope’s history of past slopes has fully turned over after 88 days.
It assumes the series jumps rather than drifts.
A metric that slides smoothly (audience fatigue, a market slowly filling up) gets reported as a step that never happened, as measured above. When the picture is a slope rather than a staircase, a trend-following or forecasting model is the right tool.
The step search misreads three shapes with nothing wrong in the data.
I planted each on quiet series and ran the search 400 times. Two rises of 15% five days apart came back as one bigger step 86% of the time, on a date that is neither change, so the date you check against your change log can be wrong. A turn, where the level climbs and then falls back with no jump, was marked near the turn only 8% of the time, and 57% of runs cut the ramps into pieces instead. And the search's penalty was set on days that echo each other at 0.45. On quiet series whose days echo at 0.7, it found a step that was not there 68.5% of the time, against 10.5% at 0.45. Set the penalty on your own quiet history, which measures your echo along with everything else.
A very recent break is not yet a break.
A boundary found three days ago has three days of evidence on one side. It may firm up or evaporate. Treat the newest stretch as provisional and let the next few days settle it.
Ratios on low-volume metrics are noise, not signal.
A click-through rate from fifty impressions moves several points on chance alone, and every detector here will happily score that. When the bottom of the ratio is small, the honest output is no reading at all.
These numbers are from synthetic data.
The catch rates, detection limits and alarm lines above describe the noise my generator produces. Yours is different. The method transfers and the numbers do not, so set your line the way the notebook set its own: on a stretch of your own history where nothing happened, before you trust its alarms.
Getting your data
There are two ways in, and both run on your own computer.
A ready-made daily export. One line per day for each metric you track, with three columns: the date, the campaign or channel name, and the number.
| column | meaning | example |
|---|---|---|
date | one line per day, no gaps in the calendar | 2026-04-17 |
series | the campaign or channel name, whatever you are tracking | Brand - Search |
value | the number itself: a rate, a cost, a count | 23.80 |
In Google Ads that is the Campaigns table, Segment → Time → Day, then Download (CSV or .xlsx), and the title lines and Total rows are set aside for you. If cost and conversions sit in separate columns, the notebook builds the rate.
A raw log of events. If you have one line per click or per conversion with a timestamp, the notebook rolls it up into a daily series first. A GA4 BigQuery export gives the same shape.
The notebook checks before it computes. Too few days, a series so flat there is no spread to measure, or a cost per conversion with too many days that had no conversion: each gets a refusal in plain words. Gaps in the calendar get a warning, because a missing day is not a zero day.
Nothing leaves your machine. The notebook reads your file from your own disk and sends it nowhere.
Common questions
My conversions dropped 30% yesterday. Is that a real problem?
Can I run this on yesterday's numbers?
What threshold should I use?
Why not just use machine learning for this?
Can I run all three at once?
How much history do I need?
The detector found a change on a date. What now?
Run it on your own series
Export one campaign's daily cost and conversions for the last few months, one line per day, and leave out the newest days while they are still filling in. Run the three detectors with the notebook above, which calibrates the alarm line on your own quiet metrics, or with the spreadsheet, which carries them in live formulas. Set the line from how many false alarms a week you can honestly chase. Next Thursday, when the red circle appears in the channel, you can say which of the three it is, or that the circled days simply have not finished arriving. Both files run on your machine and neither uploads anything.
References
- [1] Leys, C., Ley, C., Klein, O., Bernard, P. and Licata, L. (2013). Detecting outliers: do not use standard deviation around the mean, use absolute deviation around the median. Journal of Experimental Social Psychology, 49(4), 764 to 766.
- [2] Leys, C., Delacre, M., Mora, Y. L., Lakens, D. and Ley, C. (2019). How to classify, detect, and manage univariate and multivariate outliers, with emphasis on pre-registration. International Review of Social Psychology, 32(1), article 5.
- [3] Theil, H. (1950). A rank-invariant method of linear and polynomial regression analysis, I and II. Proceedings of the Koninklijke Nederlandse Akademie van Wetenschappen, 53, 386 to 392 and 521 to 525.
- [4] Hirsch, R. M. and Slack, J. R. (1984). A nonparametric trend test for seasonal data with serial dependence. Water Resources Research, 20(6), 727 to 732.
- [5] Killick, R., Fearnhead, P. and Eckley, I. A. (2012). Optimal detection of changepoints with a linear computational cost. Journal of the American Statistical Association, 107(500), 1590 to 1598.
From Stochastic Strata. I build marketing measurement that shows its working: every number carries its range, and when the data cannot answer a question, I say so and tell you what would. The worked example here is synthetic. The method is the real thing, and you can run it on your own data with the notebook or spreadsheet above. Nothing in this post is financial advice.