Conversion lag · 17 min read · Interactive · Video
Why do today's numbers look bad, and how long until I know the real result? Kaplan-Meier survival with a cure model
It is Monday, half past nine. The weekly report is up on the meeting-room screen, and last week shows 88 conversions. The week before looks fine. Nobody touched the account. Somebody suggests pausing the campaign that launched on Wednesday, and three people nod.
The short answer
Today's numbers look bad because they are young, not because anything went wrong. A conversion often arrives days after the click that earned it, and the ad platform files it under the click's date, so the newest days are always the emptiest. The fix is to measure your own filling-up curve: how much of a day's final result has arrived at each age, counting the clicks that have not converted yet as unfinished rather than failed. Statisticians call this survival analysis, built on Kaplan and Meier's 1958 estimator, with a cure model for the people who never buy. Divide a young day by its share arrived to see where it will land. On 42 test accounts with known answers, a window read off a fitted curve's tail was out by a fifth or more about half the time. The method cannot see past your own history.
Hold the pause. Last week is not worse. It is younger, and this post is about how to tell how much younger.
Last week is not worse. It is younger.
Every performance conversation starts with a recent number. Yesterday's cost per lead. This week against last. Did Tuesday's change work?
Those numbers arrive unfinished, and nothing on the dashboard says so. Google records a conversion against the ad interaction that led to it, for as long as the conversion window stays open [1]. For Search and Display that window defaults to thirty days, and you can set it anywhere from 1 to 90 [2]. So a click from yesterday has one day of a thirty-day window behind it. Most of its conversions are still in the future.
That produces three expensive mistakes, and they compound.
Pausing what is merely young. A campaign launched nine days ago looks catastrophic on day two and merely bad on day five. Cut it on day three and you never learn what it was.
Reading a change too early. You switch bid strategy on Monday and read the result on Wednesday, when Wednesday's number is two days old and two-fifths full.
Comparing periods of different ages. Last week against the week before pits a nearly finished period against an unfinished one. That is the comparison on the meeting-room screen.
What is actually going on
Picture one day's clicks. Some of those people will buy, and most will not. The buyers do not all buy at once: a few within the hour, more over the next couple of days, and a thin tail over the following weeks. So a day's conversion count is a glass filling up, and how full it is depends on how long the glass has been standing.
The hard part is that two kinds of unconverted click look identical. A click from twenty days ago that has not converted almost certainly never will. A click from an hour ago that has not converted tells you nothing. Olivier Chapelle, writing about display advertising at Criteo, put it exactly: a recent click "cannot indeed be labeled as negative for sure in that latter case because a conversion can happen in the future" [3].
Statisticians call an outcome that has not happened yet censored. Edward Kaplan and Paul Meier published the standard treatment in 1958, an estimator for people watched for a while with the outcome not yet seen [4]. Every click still inside its window is one of those.
The second complication is bigger. Most clicks never convert. On the account below, 94 per cent never will, so of every hundred people who click, 94 walk away for good. A curve that assumes everyone converts in the end has to bring them all home somehow, and the only way it can is to stretch its timescale out. That is why the naive versions go wildly wrong, in a direction that is easy to miss.
The standard fix splits the clicks into two groups from the start, those who will eventually convert and those who never will. Statisticians call it a mixture cure model [5]. In medicine the cured are the patients who never relapse. In an ad account they are the clicks that were never going to buy.
Less heart-warming, but easier to count.
The maths, unpacked
Here is the maths: two short formulas and two readings off them. After it you can check every other number here by hand.
The share that ever converts, c. Of all the clicks in a period, the fraction that will eventually produce a conversion. On the account below, 6.2 per cent.
The timing among those who do convert. I write it as a curve statisticians call a Weibull, the usual choice when most of the action is early and a thin tail runs long:
F(N) = 1 − e−(N/λ)k
- N
- days since the click.
- F(N)
- of the conversions this day will ever get, the share that has arrived by day N. This is the number you need.
- λ
- the timescale, in days. Bigger means slower.
- k
- the shape. Below 1, conversions come early: a rush, then a long thin tail. Above 1, there is a build-up first.
Put the two together and you get the survival curve, the share of all clicks that have not converted by day t:
S(t) = (1 − c) + c · e−(t/λ)k
- c
- the share of clicks that ever convert.
- 1 − c
- the flat part at the right of the curve, the share who were never going to buy.
It never reaches zero. It flattens out at 1 − c, the share who were never going to buy. That flat part is the whole trick. Its height tells you how many never convert, which leaves the rest of the curve free to describe only the people who do.
The multiplier. A day that is N days old has F(N) of its conversions in, so divide by F(N) to estimate where it lands: the estimated final is what has been reported so far, divided by F(N).
The window. Solve F(N) = 0.99 and you have the day by which nearly every conversion is in, which works out as λ · (−ln 0.01)1/k.
The worked example synthetic data
I built a paid-search account for this, one whose conversions are leads (synthetic, built so the right answer is known in advance). It has eight weeks of history and 420 clicks a day, 23,520 clicks in all. I set the share who convert and their timing in advance, and the fit is told none of it.
Cut the account at the end of week eight and you get the shape everyone knows:
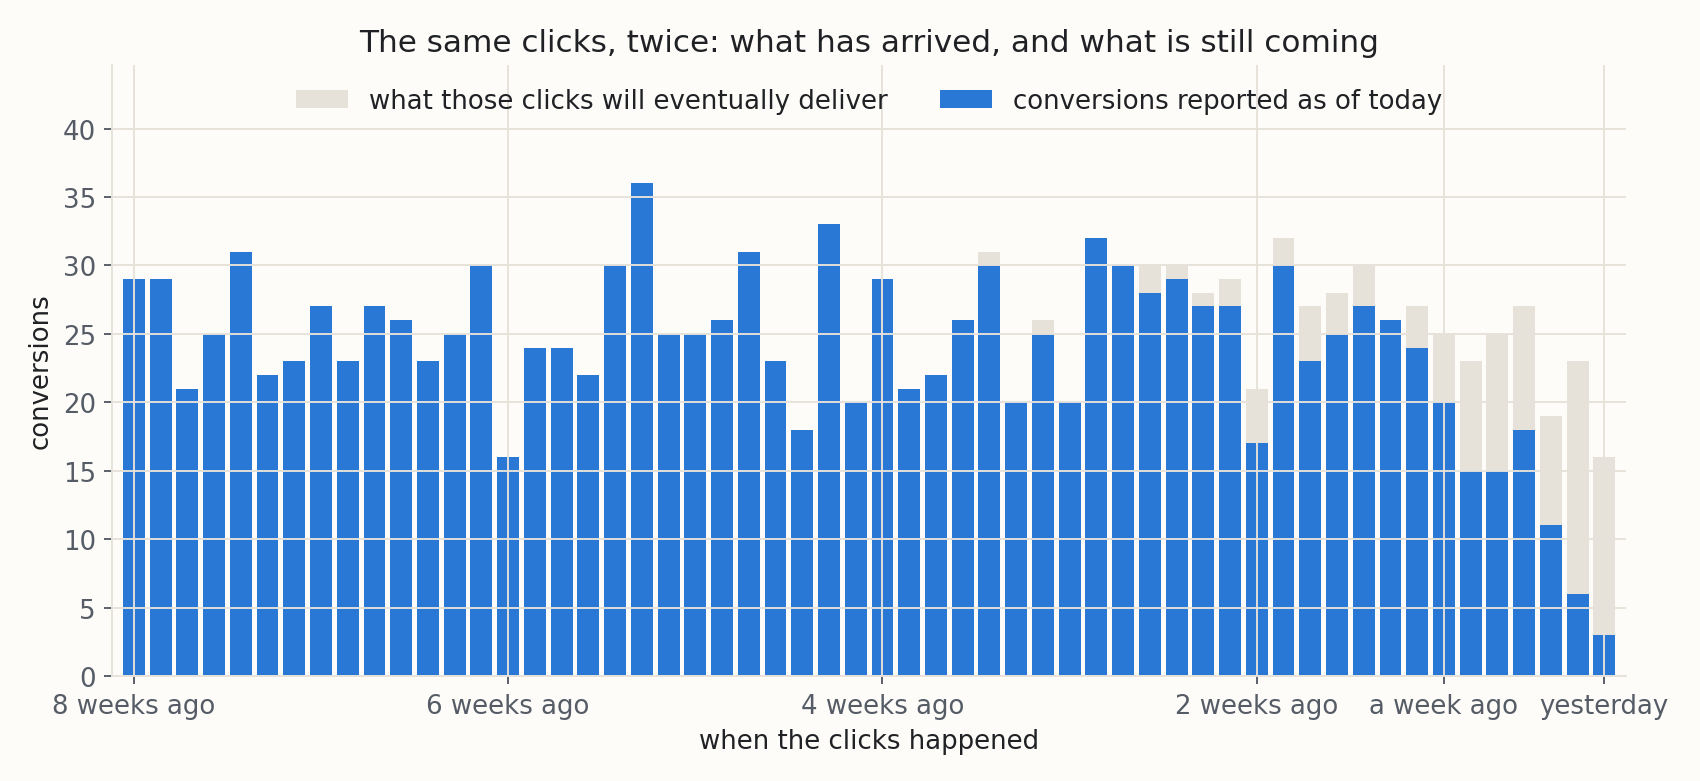
The last seven days show 88 conversions between them. Those same clicks will finish near 158.
So the week on the meeting-room screen is showing 56 per cent of itself. Every one of its days sits on the same downward slope, for no reason but age.
What the fit finds. I give the model the whole click history, 23,520 rows. Each row is a length of time plus a flag saying whether the conversion has been seen, which is exactly the input the standard Python implementation, the lifelines library, takes [6].
| Fitted | Truth | |
|---|---|---|
| Share that ever converts | 6.17% | 6.2% |
| Weibull shape k | 0.856 | 0.85 |
| Weibull scale λ | 3.98 days | 4.0 days |
The fitted share who ever convert lands within a whisker of the truth, with a range of 5.9 to 6.5 per cent. That range stays well clear of 100 per cent, which is what tells me the two groups can be told apart at all. That test matters, and it is the first caveat below.
Reading one: what to multiply by
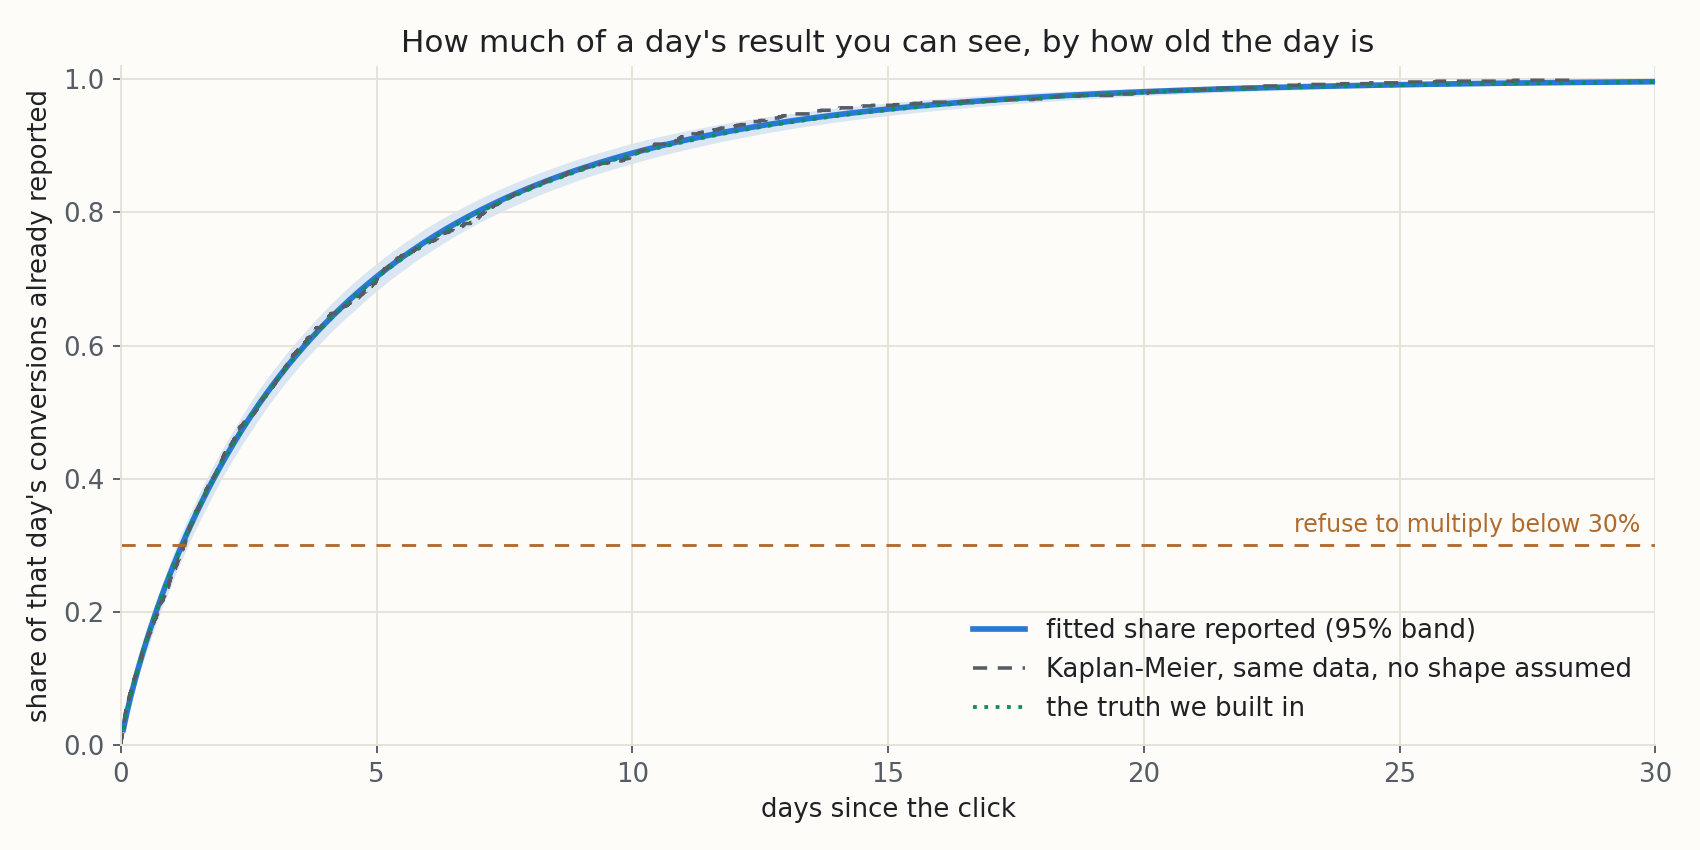
| Days since the click | Share reported | Multiply by |
|---|---|---|
| 1 | 26% | no estimate |
| 2 | 43% | 2.35 |
| 3 | 54% | 1.84 |
| 7 | 80% | 1.25 |
| 14 | 95% | 1.06 |
| 21 | 98% | 1.02 |
Read the first row again. A day-old number is showing about a quarter of itself. Not 90 per cent, not 70. A quarter.
And yesterday, read this morning, is younger still. Its clicks are on average half a day old, and about 15 per cent of their conversions are in. That is why yesterday always looks like a disaster.
The last two rows are the good news. Past a fortnight the whole problem evaporates. The correction matters enormously for three days, mildly for a week, and not at all after three.
Where the multiplier stops. The first row has no multiplier, on purpose. At 26 per cent reported the multiplier would be 3.8, and every wobble in the estimate would grow by that same factor.
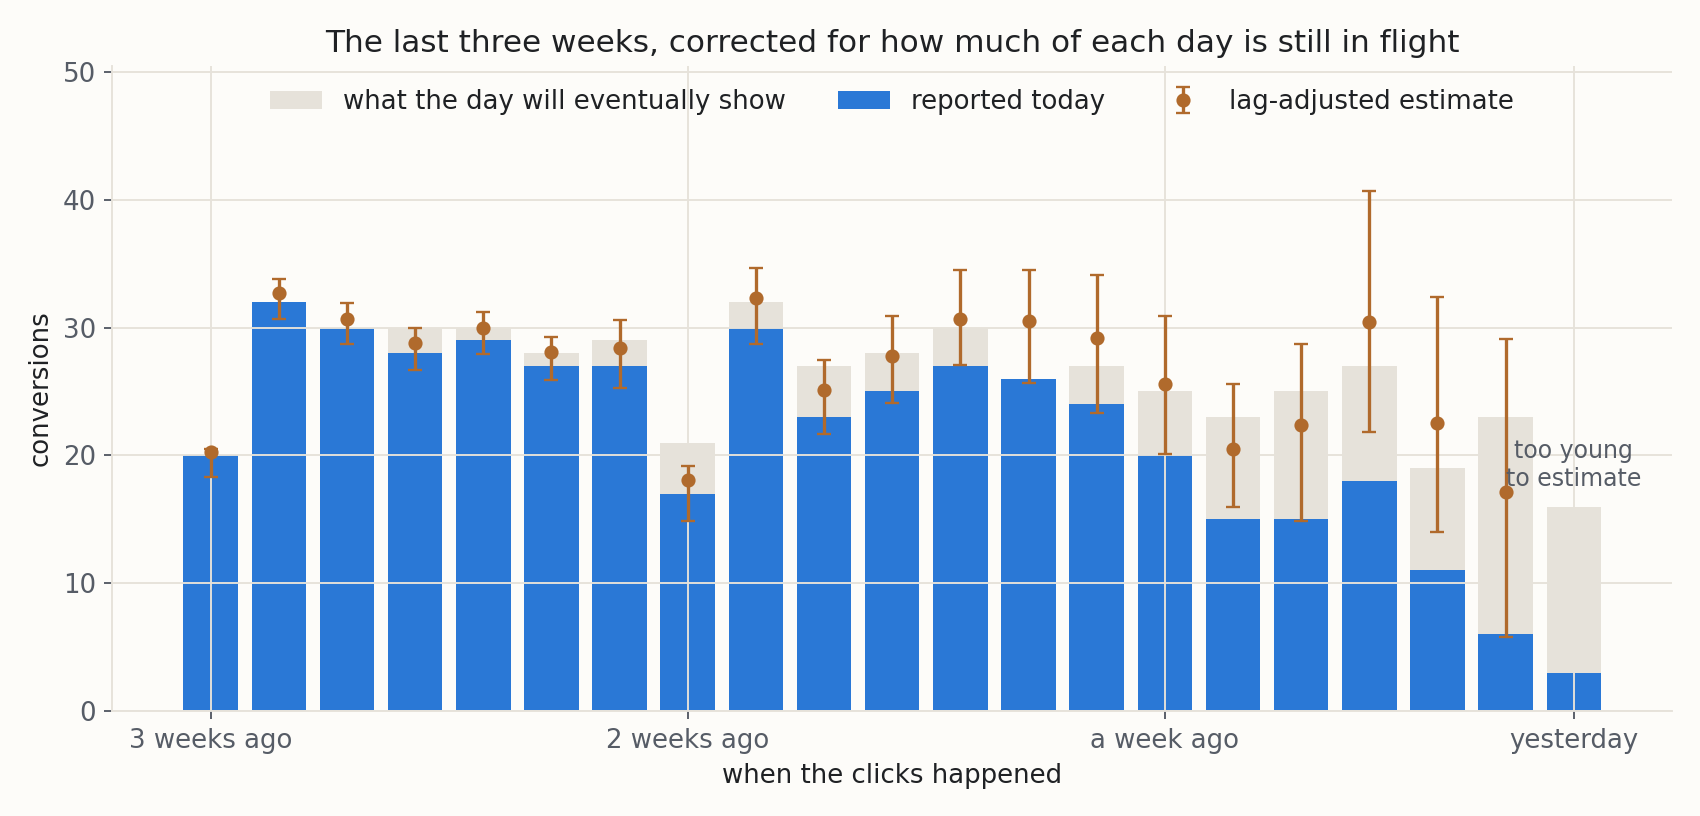
Yesterday on this account had 3 conversions reported. Three. The honest answer for a day that young is not yet.
I set the floor at 30 per cent reported, and below it the model declines to give a number. That floor is a choice rather than a law, and it is the most useful line in the method: a model that always answers will answer wrongly.
Reading two: how long your window has to be
Read the same curve at 99 per cent instead of at today's age and you get the day by which the conversions are all in. It comes out at 24 days, close to the truth I built in.
Half of all conversions land within 2.6 days. The other half take three more weeks. That early rush with a long tail is why most conversions come in fast and the window still needs to be long.
Against that, Google's default of thirty days is about right. Its own floor is lower: "windows of at least 7 days are recommended" [2]. A seven-day window on this account would report 80 per cent of the result and call it the result.
What my own platform reads. The measurement platform I build reads neither answer off this fitted curve. It reads both straight off the plain Kaplan-Meier curve, and only as far as the history still holds at least thirty clicks, and one in twenty of all the clicks, still waiting. On this account that gives a window of 22.6 days, a little under the truth, and the same reported shares to within a point.
Why not read the fitted tail? I tested both readings on 42 test cases with known answers (several synthetic worlds at different history lengths, plus a real log). The fitted tail missed the window by a fifth or more on about half of them, and the history-bounded reading on about a fifth. The fitted curve stays here as the teaching route because it names the shape and the share who never convert.
| Reading | Window | Share in after one day | Share in after a week |
|---|---|---|---|
| Fitted curve | 24 days (range 21.5 to 26) | 26% | 80% |
| My platform, read only as far as the history goes | 22.6 days | 26% | 79% |
| Truth built into the account | 24.1 days |
The two ways to get this wrong
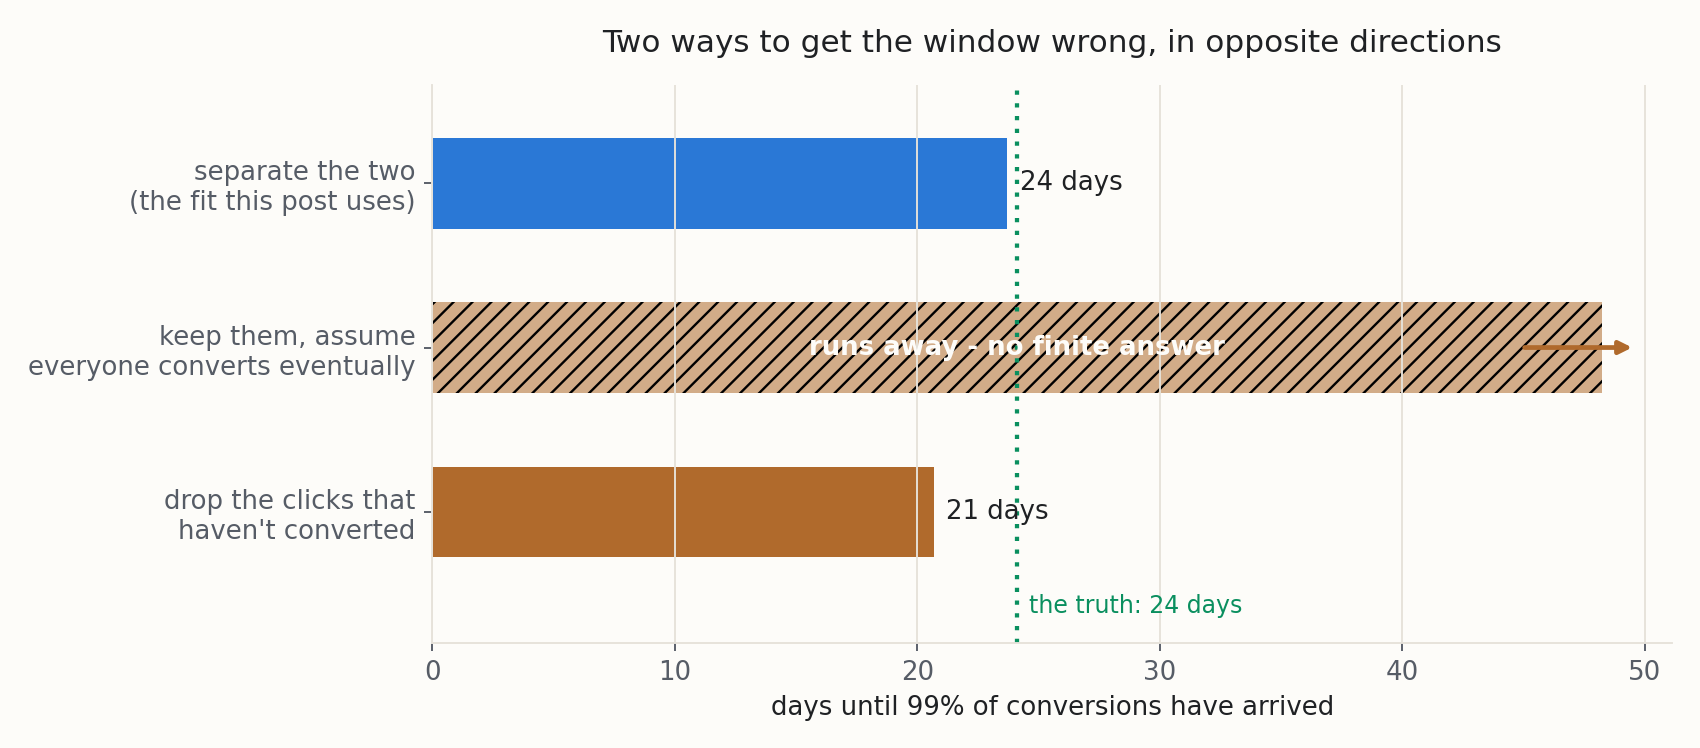
Drop the clicks that have not converted. It is the obvious move, and a spreadsheet's default: take the conversions, time each one, describe that. It gives 21 days against a true 24, because the slow converters from recent weeks have not converted yet. They are missing from the sample, and what is left is the fast ones.
Keep them, but assume everyone converts eventually. Now the answer runs away to millions of days. A curve obliged to bring everyone to a conversion can only explain the 94 per cent who never do by pushing its timescale out without limit. On a real account this shows up as a suspiciously enormous window and a fit that will not settle.
Both are avoided the same way: keep the unconverted clicks in, and let the model have a share who never convert.
Does the interval mean anything?
An interval that is right 95 per cent of the time is useful. One that is right 60 per cent of the time is worse than none, because people will believe it.
My platform resamples visitors, each with all their clicks, and re-reads its curve each time. The notebook does the same with the fitted curve, refitting it hundreds of times. Statisticians call this the bootstrap, Bradley Efron's route to an interval when a formula's assumptions are in doubt [7]. Either way the band covers sampling noise only. It cannot cover conversions arriving later than anything your history has seen.
That makes it easy to check. The notebook replays the whole exercise on forty fresh accounts and counts how often the truth lands inside the interval it would have published. The answer is 36 of 40, about what a 95 per cent interval should give within what forty replays can tell apart.
That check earned its place by failing first. My original interval caught the truth only 14 times in 40, because it carried the uncertainty in the curve and nothing else. Even with the curve known exactly, which of a day's conversions have landed so far is a coin toss for each one, and dividing by a fraction magnifies that toss too. With both carried, the intervals are about a quarter of the estimate wide, and they hold up.
Try it on your own curve
Caveats to watch out for
This is a timing correction with a measured interval. It is not an attribution method, and here is exactly where it stops.
The model finds the never-convert share where the curve flattens out. If your history is shorter than your buying cycle, the curve is still falling at the edge of your data, and everyone converts, slowly fits as well as most never convert. Amico and Van Keilegom's review sets the condition: the flat stretch has to hold for a long time before you can trust it [5]. Without it, the share that ever converts drifts up and the window comes out too long. The notebook tests for this and says so. When it fires, read the window as an over-estimate and do not pad it. My platform errs the other way: reading only as far as your history reaches, on a short history its window and multiplier come out too small, and it says so.
Inside the days your clicks have been watched, the curve is measured. Beyond them, a multiplier is a projection off the fitted tail, and the further out it sits the less it says about your account. Label it as a projection. My platform does not project at all. Past the last age its history can read, it gives no multiplier and says why.
Google Ads counts each conversion only inside the window you set, anywhere from 1 to 90 days [2]. A short window turns late buyers into never-buyers and shortens the fitted window. Fit on a window at least as long as the one you mean to read, or on your own first-party timestamps.
A form fill, a phone call and a purchase run on different clocks. A curve pooled across them fits none of them well.
A platform can take a while to show a conversion it has already recorded, on top of the gap the curve measures. Fit on rows old enough to be fully reported, or the recent days will look emptier than the curve says.
Seasonal peaks pull conversion timing in, colder audiences push it out, and a consent or tracking change can move it overnight. A curve trusted for a year will be wrong at the moment it matters most. Refit it monthly, and after anything that changes who is clicking.
The notebook cannot test this for you. Kaplan and Meier warned that "in practice this assumption deserves careful scrutiny" [4], and named a change in the population being sampled as one way it fails. Start reaching a new audience or market partway through the fitting window and the recent clicks are a different crowd. The fit is then biased, and no number in the output will say so. Fit on a stretch where targeting held still, and refit from after a change rather than across it.
A brand-search click and a cold-audience video click convert on very different timescales. Pooled, the multiplier is too aggressive for one and too timid for the other. Fit them separately.
One day in twenty should still land outside its interval if your history has already seen the slowest conversions, and more will if it has not.
This is a timing correction, not an attribution method or an incrementality test. What caused the conversions is a different question.
Someone who clicks four times in a week appears four times in the data, sharing one outcome. That makes the notebook's interval narrower than it should be. Measured on test worlds where people click two or four times, a band built on clicks held the truth 71 to 90 times in 100 against its 95, which is why my platform resamples visitors instead. Where you can, cut the data to one row per person per campaign.
Where this comes from
The estimator at the centre of this was not built for advertising. Kaplan and Meier wrote it for medical survival data, where patients are watched for a while and nobody may treat not yet as no [4]. The cure model comes from the same field, where the question is what share of patients never relapse [5]. Advertising found the same problem on its own, in Chapelle's 2014 paper from Criteo [3].
The platforms acknowledge the effect. Google ships a conversion-lag report [8] and makes the window a setting with a thirty-day default [2]. What none of them does is tell you your own curve, or refuse to show you a number too young to read.
Who this is for
Anyone can fit the curve. What changes with volume is how old the curve is by the time it is ready.
The minimum. About thirty sales you can link back to the click that brought them. A visitor who declines cookies or buys on another device still buys, but the sale cannot be tied to a click. If you can link six in ten of your sales, you need about fifty sales to get thirty into the sample. At that link rate:
| Real sales a month | Time to reach the minimum |
|---|---|
| 300 | about five days |
| 50 | about a month |
| 20 | about two and a half months |
| 5 | about ten months |
Why the time matters. Built from five days of a busy account, the curve is today's. Built from ten months of a quiet one, it is a history of your buyers, with old seasons, offers and prices folded in. Worth knowing as a rough sense of your sales cycle. Just not as this week's.
One curve per type of sale. Search and social buyers wait differently, and so do a lead and a purchase. Each curve needs its own thirty, so splitting by channel or conversion type multiplies the times above.
What you need in place first. UTM tags on every ad link, your real sales with their dates from your CRM or shop, the visits that never bought from your analytics, and, for long journeys, the ad's click ID stored with the lead so the sale can be tied to its click weeks later.
Reading it next to the platforms' numbers. Each platform counts a sale it touched as wholly its own, so their totals add up to more than you sold. The same visits and real sales feed a Markov attribution model (which channels actually drive sales), which shares each sale once across the channels that touched it. Together they give you a lag curve and a channel split built on your own sales, with no budget for a holdout test and no years of history for a marketing-mix model.
Run it on your own data
Everything runs on your machine. The notebook reads a file from a folder you point it at, and nothing is uploaded anywhere.
Getting your data out of the platform
What the file needs. One row per click, with three columns:
| Column | What it is | Example |
|---|---|---|
click_date | when the click happened | 2026-08-14 |
converted | 1 if it has converted, 0 if not yet | 0 |
conversion_date | when it converted, blank if it has not | 2026-08-17 |
The one thing that matters. The file has to include the clicks that never converted. The clicks still waiting are the whole signal.
Where to get it. No ad platform or analytics screen exports one row per click with the waiting clicks in it, so the notebook's file comes from GA4's BigQuery export. One query gives each user's first paid click, their first conversion after it, and the campaign. The exact query is in the give-to-your-AI brief that ships with this post. A CRM or server log that ties clicks and conversions to a user ID works too, and the notebook carries a consolidator for a raw log of touches.
Without either, use the spreadsheet. Google Ads carries the timing as a standard segment (on the Campaigns page, choose Segment, then Conversions, then Days to conversion) [8]. It counts conversions only, which is why it suits the sheet and not the notebook.
On Meta or LinkedIn, go through GA4. Neither exports one row per click. Tag every ad link with UTM parameters so each visit lands in GA4 marked with its platform and campaign, then filter the BigQuery rows to that source. Impressions cannot enter at all, because a view leaves no row to time.
What it will refuse to do. With fewer than about thirty converted clicks the notebook stops rather than fitting. My measurement platform asks for more before it reads a curve at all: 300 people who converted after a click in the past year, counted as people, not clicks. When the fitted window reaches past the days your file spans, it says so and marks each horizon beyond your history as a projection. Any horizon where under 30 per cent has arrived is reported as too little in yet, never as a multiplier.
This part touches a spreadsheet or a light script, but you do not have to do it alone. Download the give-it-to-your-AI brief and hand it to ChatGPT, Claude, or any capable assistant. It carries everything the assistant needs to pull your data, shape it, and run the notebook, one step at a time, even if you have never written a line of code.
Common questions
Why does my most recent day always look terrible?
How many days should I wait before judging a change?
Can I just use the platform's modelled conversions?
Does this fix over-reporting?
My conversion window is set to seven days. Does that change the answer?
What if almost nobody converts?
Try it on your own account
Export one campaign's clicks for the last eight weeks, one row per click, with the ones that never converted left in. Run the notebook and read two numbers off it: the share of a day's conversions in after one day, and the day by which 99 per cent are in. Then go back to that Monday report and divide last week by its share arrived. You will know before the meeting ends whether Wednesday's campaign deserves the pause, or just another week.
The worked example above is synthetic. The notebook runs on your data instead, and every number it gives you carries its range, or a refusal where the data cannot support one. If you want a hand with the method, or with the paid media underneath it, I take on freelance work, and I answer questions about anything published here.
Get in touchReferences
- [1] Google (undated). About attribution reports. Google Ads Help (accessed 6 September 2026). https://support.google.com/google-ads/answer/1722023?hl=en
- [2] Google (undated). About conversion windows. Google Ads Help (accessed 6 September 2026). https://support.google.com/google-ads/answer/3123169?hl=en
- [3] Chapelle, O. (2014). Modeling delayed feedback in display advertising. Proceedings of the 20th ACM SIGKDD International Conference on Knowledge Discovery and Data Mining (KDD '14), 1097 to 1105. https://doi.org/10.1145/2623330.2623634
- [4] Kaplan, E. L. and Meier, P. (1958). Nonparametric estimation from incomplete observations. Journal of the American Statistical Association, 53(282), 457 to 481. https://doi.org/10.1080/01621459.1958.10501452
- [5] Amico, M. and Van Keilegom, I. (2018). Cure models in survival analysis. Annual Review of Statistics and Its Application, 5, 311 to 342. https://doi.org/10.1146/annurev-statistics-031017-100101
- [6] Davidson-Pilon, C. (undated). lifelines documentation, KaplanMeierFitter (accessed 6 September 2026). https://lifelines.readthedocs.io/en/latest/fitters/univariate/KaplanMeierFitter.html
- [7] Efron, B. (1979). Bootstrap methods: another look at the jackknife. Annals of Statistics, 7(1), 1 to 26. https://doi.org/10.1214/aos/1176344552
- [8] Google (undated). Find your conversion lag reporting data. Google Ads Help (accessed 6 September 2026). https://support.google.com/google-ads/answer/9347065?hl=en
From Stochastic Strata. I build marketing measurement that shows its working: every number carries its range, and when the data cannot answer a question, I say so and tell you what would. The worked example here is synthetic. The method is the real thing, and you can run it on your own data with the notebook or spreadsheet above. Nothing in this post is financial advice.