Forecasting · 17 min read · Interactive · Video
What will I get next month if nothing changes, and how far can I trust that number? A simplified Silverkite forecast
The finance lead wants next month's conversions by Friday. Last month's total, the recent average and a ruler through the chart all give a number, and none says how far off it might be. I built the forecast I use from LinkedIn's published method, checked its range on five hundred accounts, and found where a ruler beats it.
It is Wednesday afternoon, and the finance lead has sent one line. "Next month's conversions by Friday, please. I'm setting the budget against it."
You open the account (synthetic, built so the right answer is known in advance). Last month brought 3,006 conversions. A colleague suggests the last four weeks' daily average times thirty, which gives 2,977.
So you hold a ruler against the chart and read off 3,159. I did exactly this for years. Three sensible numbers, and not one of them says how far off it might be.
This post is about a fourth number, and about the range that should travel with it.
The short answer
If nothing changes, next month brings what your recent trend and weekly rhythm point to, and the honest way to say it is a number with a range, which you should trust a little less than it claims. In my tests a range promising nine months in ten caught the real total about 77 times in a hundred. The forecast fits a trend that can bend, a weekly rhythm and a carry-over from yesterday, all together. It is a simplified Silverkite, the forecaster described in LinkedIn's 2022 paper on its Greykite library. Fit it to three months or more of daily conversions and read off the month's total with its range. Across five hundred test accounts, last month's total came in low on 98 per cent of growing ones. The method cannot see a change you already know about, such as an approved budget rise.
Which methods this uses, and why not the others
The method here is a simplified Silverkite, the forecaster LinkedIn's data scientists built for their own business and published in 2022 [1]. The full model adds up six parts (growth, seasonality, holidays, carry-over from recent days, outside drivers and their interactions) [1, p. 3]. I keep three: a trend that can bend, a weekly rhythm, and yesterday's leftover carried forward. Every line is written out in the notebook.
The three shortcuts. Last month's total, the recent average times thirty, and a ruler through the chart. The textbook calls them the naive, mean and drift methods, and treats them as benchmarks to beat rather than forecasts to plan on [2]. (Strictly, my ruler is a cousin of drift: a line through the last eight weeks, where drift uses the average change over the whole history [2].) They take a minute and anyone can follow them. The ruler is as close a guess as my forecast whenever the last eight weeks are the whole story. But the two anchored ones lean low on any growing account, the ruler does not know which weekdays the month holds, and none of the three carries a range.
Prophet, the popular open-source forecaster. It handles holidays and yearly cycles out of the box and has a huge user base, which matters when you need help. In the words of the team behind the rival library, "it does not perform as well for short-term forecasts" [1, p. 2], because nothing in it carries recent days forward. Next month is a short-term forecast, and that carry-forward is one line of my method.
Seasonal ARIMA, the classical one. It is in every statistics package and has forty years of theory behind its range. The same paper finds it too rigid for weekly patterns that change over time, or for wobble that grows around holidays and weekends [1, p. 2]. Its settings are also hard to explain to a client.
A neural network, sold as AI forecasting. Trained across hundreds of series, it can learn shapes no hand-written model contains. One account is not an archive, though, and the paper finds the leading deep-learning forecaster hard to interpret or correct with what you know [1, p. 2].
On the paper's own benchmark, Silverkite came out best on 20 of the 24 combinations of dataset and horizon [1, p. 7]. The score compares each method with a naive rule (statisticians call it a scaled error), and above one means worse than that rule did on its own history. On daily data thirty days out, all three methods scored above one. That horizon is hard for everyone. And this is LinkedIn's team marking LinkedIn's method, so the rest of this post marks it on accounts I built myself.
One thing that answers a different question. "Did my change work?" is not a forecasting question. Whether something you did caused a departure from the forecast is the job of an interrupted time series, which has its own post.
| method | benchmark score, daily, thirty days out |
|---|---|
| Silverkite | 1.251 |
| Prophet | 1.575 |
| seasonal ARIMA | 1.705 |
The question underneath
Next month's number is what a budget, a sales rota, a stock order and a target are set against, each a month ahead. Each is hurt more by a number that is confidently wrong than by a range that is honestly wide. The range has a proper name, a prediction interval: a stretch within which the real figure should land with a stated probability [3]. For a planning decision, the range is the forecast.
The formula, written out
Here is the maths. It takes two lines, and the notebook does every step in the open.
The forecast writes the logarithm of each day's conversions as three parts, fitted together in one regression:
log yt = g(t) + s(t) + rt
- The trend, g(t), is a straight line allowed to bend. I lay down a possible bend every two weeks and judge them on weekly averages, because day-to-day noise comes in clumps and a clump looks like trend. A search keeps only the bends that pay for themselves. The real library does this with the adaptive lasso [1, p. 4], mine with a stepwise search and a penalty for complexity.
- The weekly rhythm, s(t), is three pairs of sine and cosine waves with a seven-day period. That sounds fancier than it is: it amounts to one adjustment per weekday.
- What is left, rt, resembles yesterday's leftover, so the model measures how strongly, as a number φ between zero and one, and carries the last leftover forward, fading it by φ each day. Statisticians call this autoregression.
The range has two parts, and the second is the one most write-ups leave out:
widthh ∝ √( σ² · (1 − φ2h) ÷ (1 − φ²) + trend uncertaintyh )
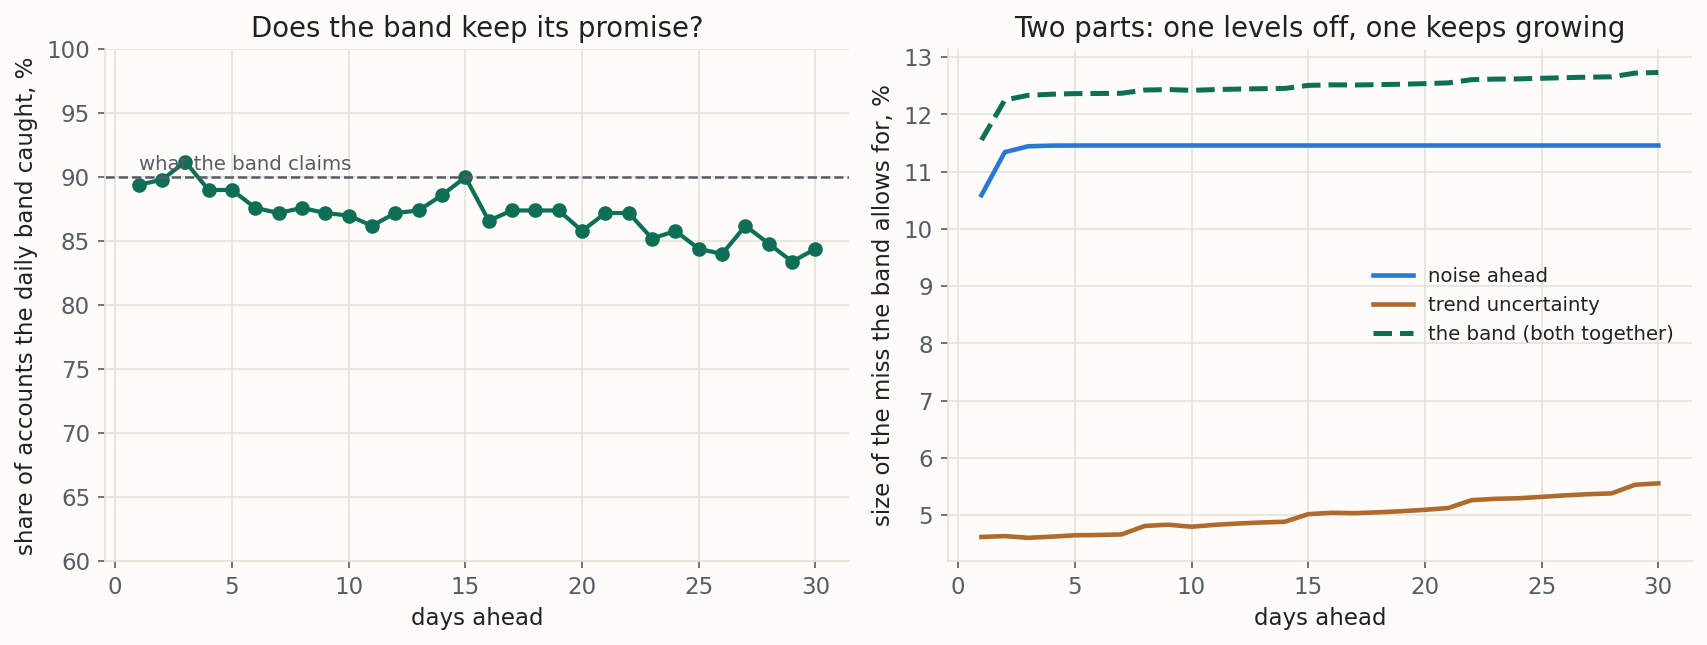
The first part is the noise ahead, where σ is one day's genuine surprise. It grows with the horizon h and then levels off, as the memory of the last known day fades. The second part is how unsure the fitted trend is. A slope through six months of data is known only so well, and the further out you read it, the more that matters. It never levels off.
The textbook is blunt about ranges built from the noise alone: "ARIMA-based intervals tend to be too narrow" [4]. They leave out doubt about the fitted settings and about the choice of model [4]. My range puts the fitted settings back in. It still leaves out the choice of model (which bends the search kept), and the measurements below show what that costs.
Why logs. Conversions swing in proportion to their level. A fifteen per cent weekend dip is fifteen conversions on a hundred-a-day account and fifty on a three-hundred-a-day one. Logs make those swings additive, and give each day's range more room above than below.
The worked example
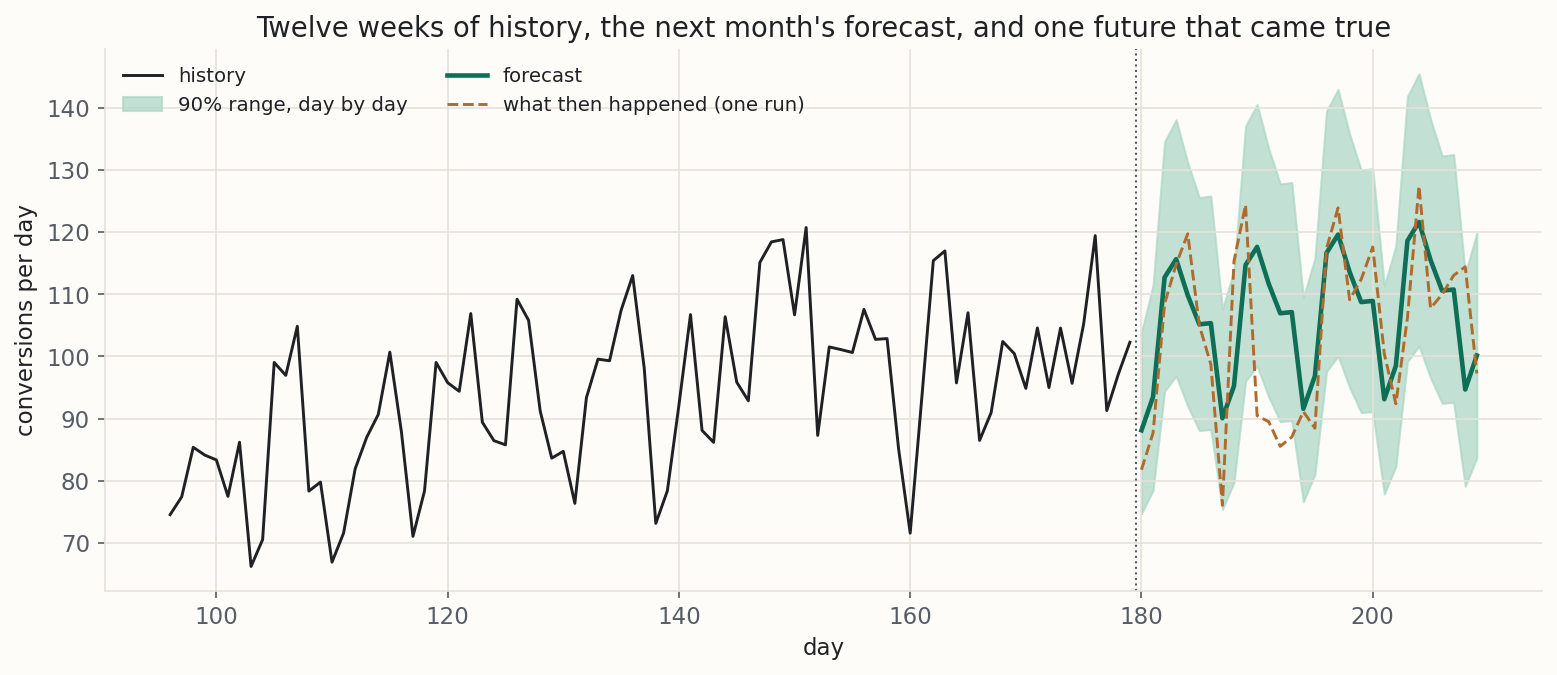
The account. The notebook builds the advertiser from the opening with its future decided in advance. It starts at 70 conversions a day and grows steadily. Halfway through, a creative refresh lands and growth more than doubles. A straight line through all six months describes neither half, which is why the trend may bend. The full recipe is in the table below.
The forecast. The search kept no bends at all. Twelve weeks after the refresh, the change was still too faint to tell from a run of good weeks. The fit also read a little less noise than I built in, having quietly eaten some of it, which is the first clue to why the range runs narrow.
The next thirty days come out at 3,212 conversions, with a range of 3,011 to 3,413. Then I let the account run on by the same rules, and that future brought 3,113. The forecast was 3.2 per cent high, and the range caught it.
One run is one run. The account's last four weeks happened to run at 95.1 per cent of its underlying level, and nothing that reads the history can tell a run of ordinary days from a lower level.
| part | built in | the forecast read |
|---|---|---|
| starting level | 70 a day | |
| growth, first quarter | 14.5% | |
| refresh lands on day | 90 | |
| growth per quarter after | 37% | |
| days of history | 180 | |
| level on the last day | 109.4 a day | |
| Tuesday against the average | 1.10 | |
| Saturday against the average | 0.84 | |
| daily wobble | 12% | |
| how much today resembles yesterday | 0.4 | 0.391 |
| one day's genuine surprise | 11.0% | 9.3% |
| bends, of 10 candidates | one, on day 90 | none |
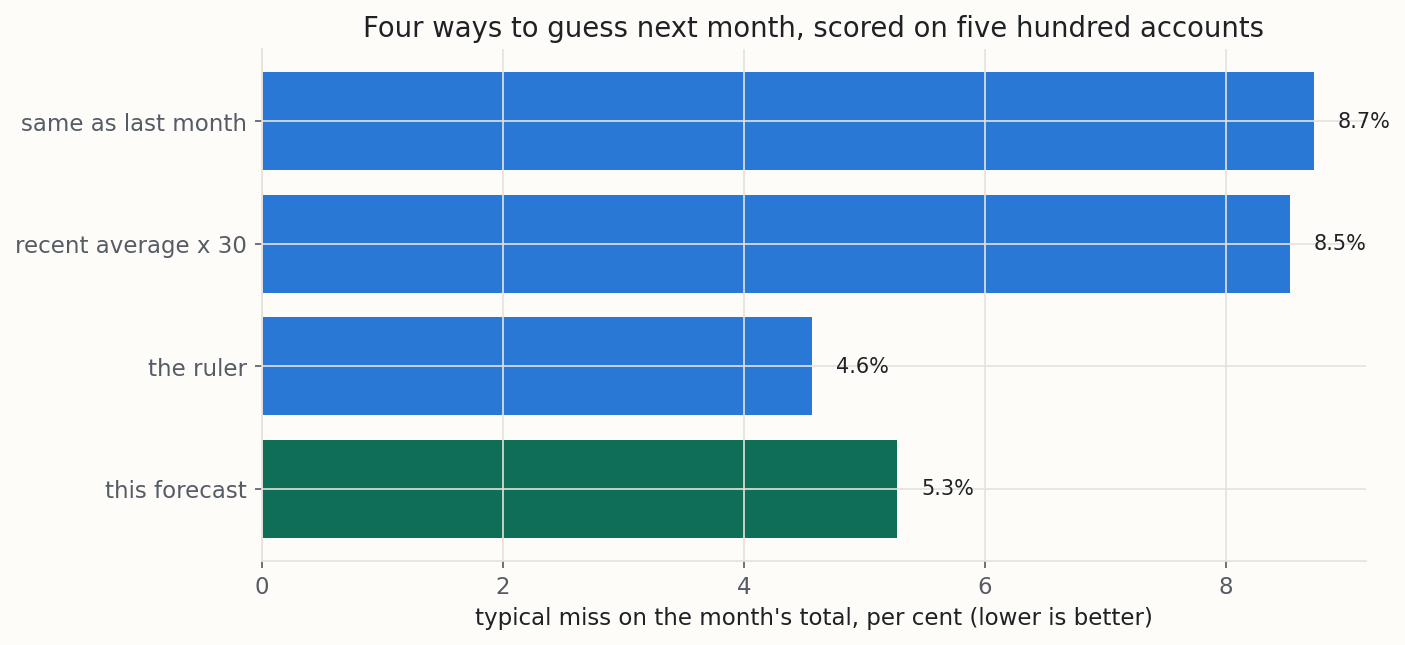
Five hundred accounts. So I built five hundred accounts by the same rules and scored every method on every one. The anchored shortcuts came in low almost everywhere: last month's total on 98 per cent of the accounts, the recent average on 97 per cent. The ruler and the forecast were a close match. The typical miss is the middle of the misses, ignoring direction.
| method | typical miss | within 10% | leans |
|---|---|---|---|
| same as last month | 8.7% | 60.6% of accounts | 8.7% low |
| recent average times thirty | 8.5% | 61.8% | 8.5% low |
| a ruler through eight weeks | 4.6% | 81.6% | 1.4% high |
| this forecast | 5.3% | 82.4% | 0.4% low |
The search kept a bend on 75 per cent of the accounts, and one within three weeks of the real bend on 39 per cent. Where it kept none, the forecast leans the old way.
Other shapes of account. The ruler reads the last eight weeks and nothing else, so it wins exactly when those weeks are the whole story. I built three hundred accounts of each shape below. The ruler is the closer guess on three of the nine, every one an account whose growth changed within the last two months. On a flat account, or one whose growth stopped, last month's total is as good as anything. Everywhere else the forecast is closer: it knows which weekdays the month holds, and a step throws it half as far as it throws the ruler. On every shape it is the only one with a range.
| account shape | last month | the ruler | this forecast | range caught |
|---|---|---|---|---|
| flat | 3.5% | 6.2% | 3.8% | 75.3% |
| steady growth | 9.0% | 4.5% | 3.9% | 82.0% |
| steady decline | 6.9% | 5.4% | 3.9% | 78.0% |
| growth changed twelve weeks ago | 8.9% | 5.7% | 5.6% | 71.7% |
| growth changed six weeks ago | 9.5% | 4.5% | 6.8% | 60.7% |
| growth changed three weeks ago | 9.2% | 5.4% | 6.0% | 59.0% |
| growth stopped eight weeks ago | 3.3% | 5.5% | 6.0% | 72.0% |
| growth turned to decline twelve weeks ago | 5.7% | 5.3% | 4.4% | 78.0% |
| a step down six weeks ago | 8.9% | 15.3% | 8.4% | 65.3% |
Does the range keep its promise? It claims nine in ten. For a single day it caught about 87 accounts in a hundred, sliding a little as the month went on. For the month's total it caught about three in four, and keeping its word would take a range about a third wider. The reason is mundane: the fit ate a little noise and called it signal, and the range is sized from what was left.
Which part of the range matters. For a single day, the noise ahead dominates, and only 0.1 per cent of the last known day's memory is left after a week. For the month's total the daily noise partly averages out and the trend's doubt does not, so 62 per cent of the total's uncertainty, measured as variance, comes from the trend. The month's number is limited by how well you know where the account is heading, not by how bumpy the days are.
| the range, across 500 accounts | result |
|---|---|
| daily, average over the month | 87.1% |
| daily, first day | 89.4% |
| daily, thirtieth day | 84.4% |
| the month's total | 76.6% |
| widening needed, daily on day thirty | 1.15 times |
| widening needed, the total | 1.36 times |
| typical surprise (11.0% built in) | 10.6% |
| typical resemblance (0.4 built in) | 0.37 |
| trend's share of the total's range | 61.8% |
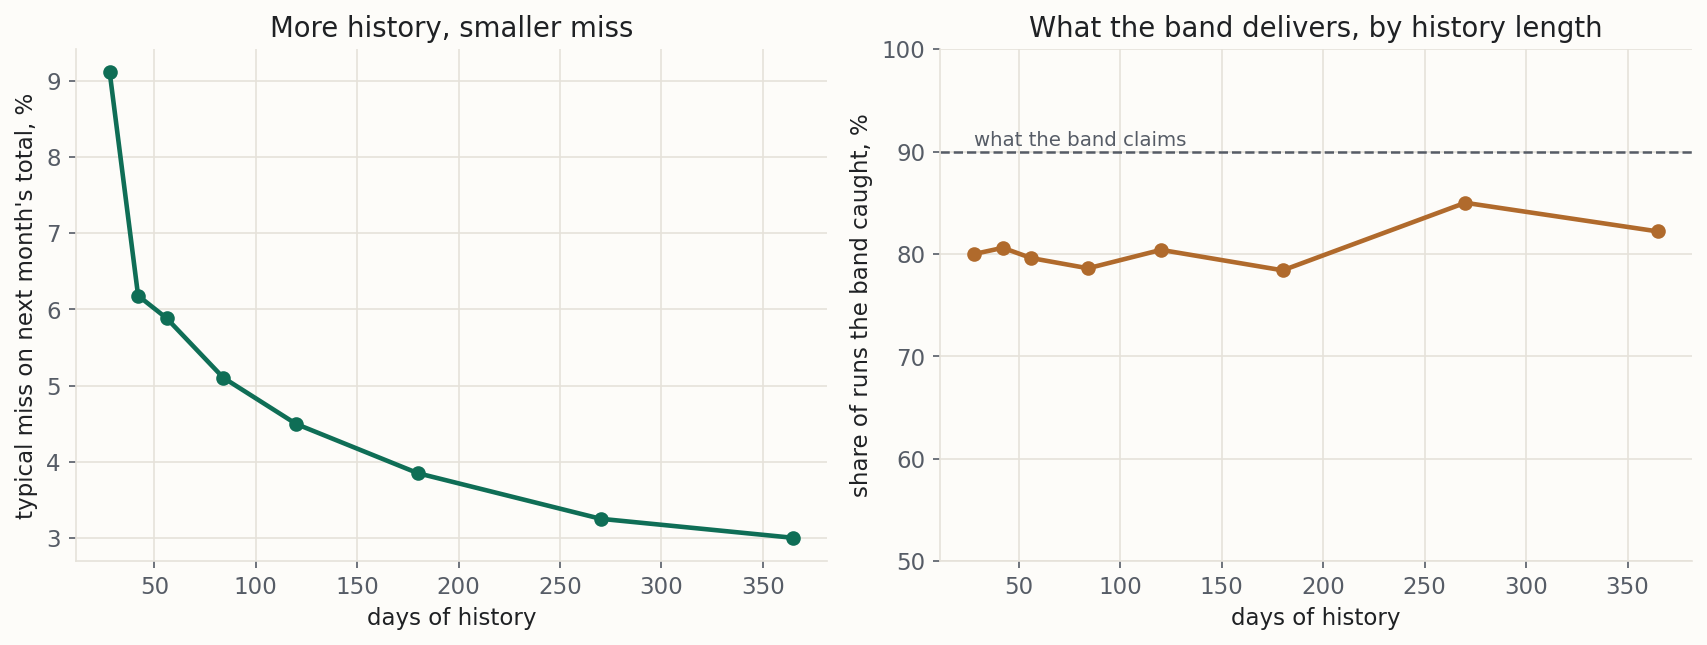
How much history you need. I built a steadily growing account 500 times at each history length and scored next month's total.
| days of history | typical miss | range caught the truth |
|---|---|---|
| 28 | 9.1% | 80.0% |
| 42 | 6.2% | 80.6% |
| 56 | 5.9% | 79.6% |
| 84 | 5.1% | 78.6% |
| 120 | 4.5% | 80.4% |
| 180 | 3.9% | 78.4% |
| 270 | 3.3% | 85.0% |
| 365 | 3.0% | 82.2% |
The rows under 90 days are tests only. My platform reads at most a third of the history ahead, so it would not forecast a month from them. The miss is still shrinking at a year, while the range catches the truth 78 to 85 times in a hundred at every length. More history buys a sharper forecast, not a more truthful range.
Checked against the account's own past. The notebook also runs the one check you can run on a real account: pretend the history ended earlier, forecast the month that followed, and compare. At five cut-offs the forecast was typically 2.6 per cent off, and the range caught 5 months out of 5. That is a thin check. It can flag a bad forecast and cannot certify a good one, but it is free.
What it is worth. A typical month on these accounts brings about 3,472 conversions. At a round 40 euros each, every miss is spend planned against the wrong number. Planning on last month's total costs about 4,800 euros a month more than planning on the forecast. On this shape the ruler is 985 euros a month cheaper than the forecast, and only one of the two says how far it might be off.
| guess | typical miss, conversions | typical miss, euros a month |
|---|---|---|
| same as last month | 303 | 12,120 |
| recent average times thirty | 296 | 11,841 |
| the ruler | 158 | 6,336 |
| this forecast | 183 | 7,320 |
Play with the forecast
Set how much history the forecast gets, how fast the account grows, how noisy its days are, and a planned lift it is not told about, then watch the forecast, its range and the month's total move. The five pinned cases are the ones the notebook stores, and the widget reproduces all of them with the same maths and says so at the bottom.
Caveats to watch out for
Every method has situations where it gives a confident wrong answer. These are this one's, in order of how often they will catch you, most common first. The measurements are in the tables at the end.
It cannot see a change you already know about.
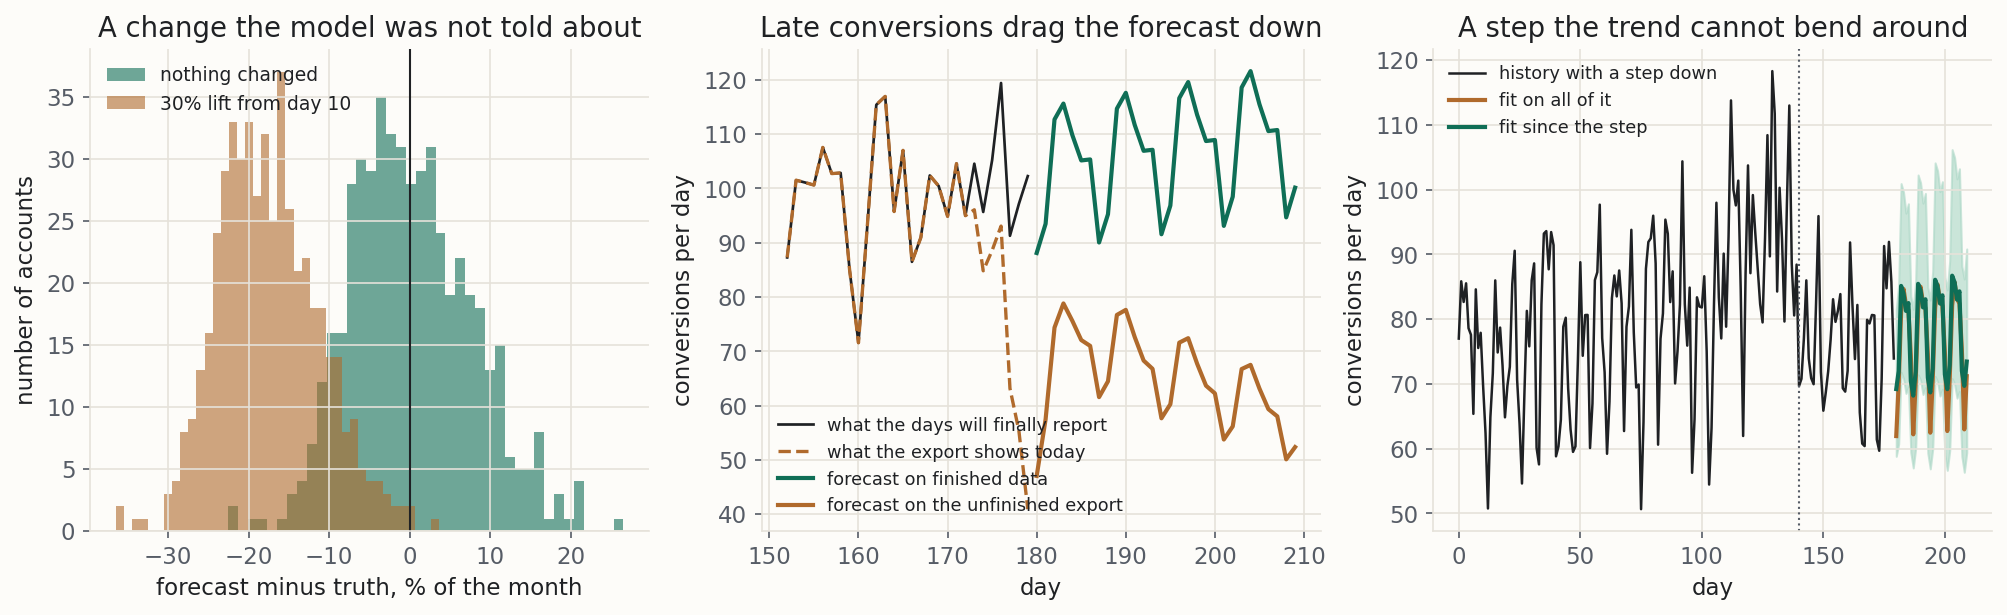
This is the most common failure, and the most avoidable. A budget rise approved on the first lands on the tenth, and history contains no rise that has not happened yet. In my test, a 30 per cent lift from day 10 left the forecast well short, and its range caught the real number about one time in nine. A wider range is not the repair. Telling the model is. The real library takes a known change as an input. Mine does not, so adjust the number by hand and say that you did.
The last few days of your export are not finished yet.
Conversions arrive late, so the newest days are under-counted for weeks, up to your conversion window. On one real advertiser's data, the last two weeks still held only 69 per cent of their eventual count. A forecast fitted on those days sees a dip that is not there and projects it forward. In my test it came out about a quarter low. Cut the days your lag curve says are unfinished (a week, on my synthetic lag) and the gap all but vanishes.
A step change is read as a slope, and extrapolated the wrong way.
A pricing change, a tracking fix, a lost placement: the level moved and stayed moved. A bend is a change of slope, not a step. I tested a 25 per cent drop in level 40 days before the end. Fitted on everything, the search kept a bend on 94 per cent of accounts, against 75 per cent with no step at all, and carried the fall on into next month. Fitted only on the days since, the forecast was centred again, and its range caught the truth 82 times in a hundred. The forecast does not find the step itself. Look at the chart and cut the history there.
A change in growth that is too fresh to see.
The bend search is a detector, and detectors err both ways. On a flat account it invents a bend about a third of the time, at a small cost in accuracy. On an account like the worked one it earns that back. But for a change the worked account's size, it finds the bend about one time in five when the change is four weeks old, and about half the time at eight or twelve weeks. That is why the ruler wins the fresh-change rows of the shapes table, and why you should look at your own chart after a change of gear.
The range is narrower than it says, and more history does not fix it.
Nine in ten claimed, about 77 in a hundred delivered for the month's total, and about 87 for a single day. The textbook names the missing doubts as the fitted settings and the choice of model [4]. My version carries the first and not the second. The notebook reports the widening needed, so you can widen it by hand.
Beyond a month, the maths gets less honest and the condition gets less likely.
Even on accounts that never change, the range's catch on the total falls from 86.0 per cent a week out to 64.6 at three months. On a real account the condition breaks too, because "the calculation assumes that the historical patterns that have been modelled will continue into the forecast period" [4]. Forecast a month, act, and forecast again.
It cannot tell you why.
Whether the growth came from a better creative, a cheaper auction or a competitor's absence is not in these numbers.
Small counts do not belong here.
Zero-conversion days are refused, and single-digit days are practically noise. Forecast a larger number, such as weekly totals, clicks or the whole account.
These numbers are from synthetic data.
They describe an account I generated, with the answer built in. Yours has a different shape. The method transfers and the numbers do not, which is why the notebook reads the forecast off your figures.
| what I tested | result |
|---|---|
| 30% lift from day 10: adds to the month | 21.5% |
| that lift: the forecast | 18.0% low |
| that lift: range caught | 11.0% |
| lag: newest day shows | 40% |
| lag: week-old day shows | 91.9% |
| unfinished days in: the month | 24.3% below |
| unfinished days in: worked account | 1,978 against 3,212 |
| unfinished week cut: the month | 0.2% below |
| unfinished week cut: worked account | 3,216 |
| 25% step, fitted on everything: the forecast | 5.9% low |
| fitted on everything: range caught | 68.0% |
| fitted on everything: kept a bend | 94.4% |
| fitted on the 40 days since: the forecast | 0.3% high |
| fitted since: range caught | 82.4% |
| flat account: bend invented | 35% |
| flat account: miss, search on and off | 4.1% and 3.1% |
| flat account: range caught, off and on | 88.0% and 79.3% |
| worked shape, search on | 0.2% high, 73.3% caught |
| worked shape, search off | 5.5% low, 63.3% caught |
| change four weeks old: found | 20.3% |
| eight weeks old | 52.7% |
| twelve weeks old | 49.3% |
| how far ahead | range caught the total | typical miss | trend's share of the last day's range |
|---|---|---|---|
| a week | 86.0% | 5.1% | 14% |
| a fortnight | 83.0% | 5.1% | 15% |
| a month | 76.6% | 5.3% | 19% |
| two months | 71.0% | 5.9% | 25% |
| three months | 64.6% | 7.3% | 32% |
Getting your data
You need one line per day with two columns, in any order:
| column | what it holds | example |
|---|---|---|
date | the calendar date, any ordinary format | 2026-03-17 |
conversions | that day's conversions, leads, sales or sign-ups | 84.5 |
Other columns are ignored. If your export has several campaigns, filter to one or add them up per day. A forecast of a mixture is fine. A file with five lines per date is not.
From Google Ads, download the campaign view segmented by day, with its Day and Conversions columns. From an events export or a warehouse, one line per conversion with a timestamp is enough: the notebook adds them up per day and fills empty dates with zeros so you can see them.
The notebook refuses days with zero conversions, because the logarithm of zero does not exist. Forecast a bigger number instead. It also refuses fewer than 14 days of history, and reads at most a third of the history ahead, never more than 30 days, so a month's forecast needs about three months of data.
The notebook runs on your own computer. Nothing about your account leaves it.
The same method, in production
LinkedIn built this forecaster for its own performance management, first for its advertising business, LinkedIn Marketing Solutions [1, p. 7]. One requirement that work taught the authors was carrying recent days forward to sharpen the next day's forecast [1, p. 7], the same carry-forward my method uses. The library is open source, and my platform's forecaster is designed around it.
Common questions
How far can I trust the number?
How much history do I need?
Can I forecast three months out?
I have already approved a budget change for next month. What do I do?
My export has days with zero conversions.
My ruler through the last eight weeks does about as well. Why bother?
Should I just use Prophet, or what my dashboard tool offers?
What does "if nothing changes" actually mean?
Try it on your own account
Export six months of one account's daily conversions, a date and a count on each line. Run the notebook, read off the month's total and its range, and let it check the range against your own past months. Add any approved change by hand. Then answer the finance lead's line from Wednesday: one number, the range beside it, and a sentence saying to read the range as three in four.
References
- [1] Hosseini, R., Chen, A., Yang, K., Patra, S., Su, Y., Al Orjany, S. E., Tang, S. and Ahammad, P. (2022). Greykite: Deploying Flexible Forecasting at Scale at LinkedIn. Proceedings of the 28th ACM SIGKDD Conference on Knowledge Discovery and Data Mining (KDD '22), pages 2, 3, 4 and 7. Accessed 13 September 2026.
- [2] Hyndman, R. J. and Athanasopoulos, G. (2021). Forecasting: Principles and Practice, 3rd edition, section 5.2, "Some simple forecasting methods". OTexts, Melbourne. Accessed 13 September 2026.
- [3] Hyndman, R. J. and Athanasopoulos, G. (2021). Forecasting: Principles and Practice, 3rd edition, section 5.5, "Distributional forecasts and prediction intervals". OTexts, Melbourne. Accessed 13 September 2026.
- [4] Hyndman, R. J. and Athanasopoulos, G. (2021). Forecasting: Principles and Practice, 3rd edition, section 9.8, "Forecasting". OTexts, Melbourne. Accessed 13 September 2026.
All figures in this post come from the accompanying notebook, which builds its own data with the answer built in, so every reading can be scored against the truth. The data is synthetic throughout.
From Stochastic Strata. I build marketing measurement that shows its working: every number carries its range, and when the data cannot answer a question, I say so and tell you what would. The worked example here is synthetic. The method is the real thing, and you can run it on your own data with the notebook or spreadsheet above. Nothing in this post is financial advice.