Search terms · 16 min read · Interactive · Video
Which search terms should I block, and which deserve a chance? The Wilson score interval
It is review day. The search terms report has four hundred rows, and a dozen of them are painted red: each one spent real money and converted nothing. My cursor is already on "Add as negative keyword". For most of those rows, that click is a coin toss.
The short answer
Block a search term straight away only when it has nothing to do with what you sell, and give every other term enough clicks for "no conversions" to mean something before you judge it. How many clicks is enough comes from a range of plausible conversion rates, called the Wilson score interval, which Edwin Wilson published in 1927 and which Brown, Cai and DasGupta's review of the alternatives recommends for small counts. Against a 4% benchmark, a term with no conversions needs 93 clicks before that whole range sits below 4%. At 30 clicks it could still be anywhere from 0% up to 11%. The lower your usual conversion rate, the longer every term has to wait. The method cannot judge relevance for you. The first step rests on a list of words you write, and a word missing from that list blocks good terms without any warning.
Why the obvious click is a coin toss
Every day your campaign runs, the search engine matches your keywords to searches you never bid on. Some are gold, a phrase describing exactly what you sell, found for free. Some are junk. This stream is where both the opportunity and the waste live.
The rule most account managers run in their heads is simple: the moment a new term has spent money without converting, add it as a negative. It feels tidy. It is also how good terms quietly vanish from accounts, because it trusts a conversion count far too small to say anything.
The idea, in plain words
A term's conversion rate is a share: conversions out of clicks. With a handful of clicks, that share is barely known. You would expect no conversions from three clicks even on an excellent term.
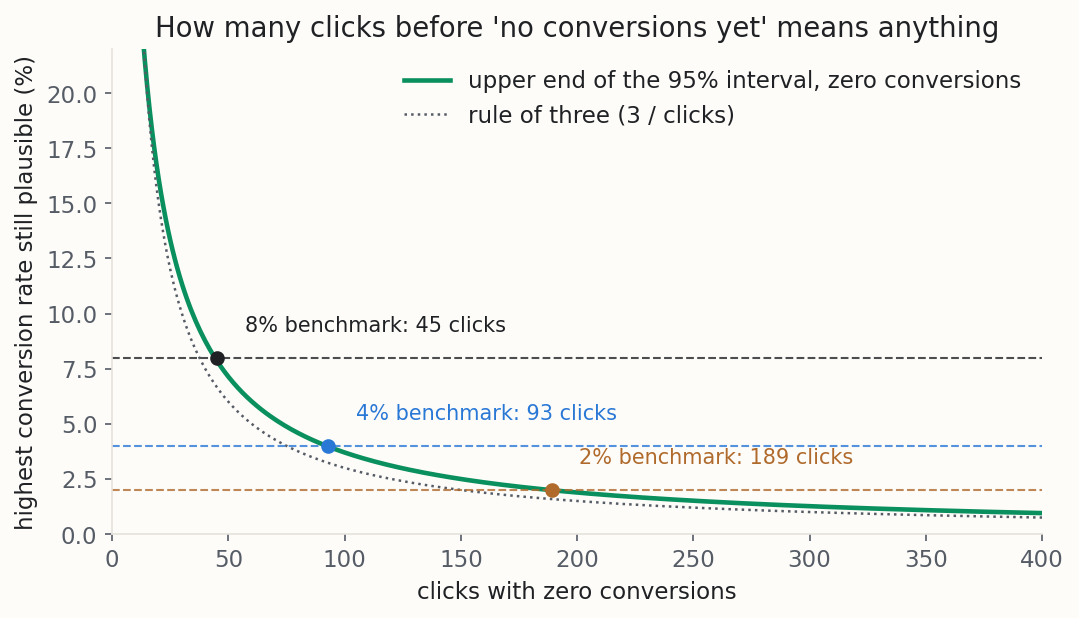
So stop reading the rate the report shows and start reading the range of rates still plausible. A term with no conversions in 30 clicks has a range from 0% up to about 11%. Your benchmark sits inside it. The data cannot yet tell this term from an average one, so there is nothing to decide.
Give the same term ninety-three clicks, still without a sale, and the range shrinks to just under 4%. Now the whole range sits below your benchmark, and blocking it is a judgement the data supports rather than a hunch. That is the entire trick: the range narrows as clicks pile up, and you act when it clears the line you set, not when your patience runs out.
And that line is yours to choose. Ninety-three clicks is where the term becomes worse than average at 95% confidence, which is not the same as useless. Its true rate could still be three per cent, and most people would keep a three per cent term running because it still pays. So set the benchmark at the rate below which a term stops paying for itself, usually lower than the account average, and the same arithmetic hands you the click count for that line.
The formula, written out
Here are the two pieces of maths in this post. The first gives the range. The second turns it into the number you want: how many clicks a term needs before it can be judged.
The range. For x conversions in n clicks, the Wilson score interval is
| term | what it is | what it means for your term |
|---|---|---|
| x, n | conversions, clicks | raw counts, never a rate the platform has already divided out |
| p̂ = x/n | the rate the report shows | the number not to trust on its own |
| z | how sure you want to be | 1.96 for 95%, 1.64 for 90%, 1.28 for 80% |
| z²⁄2n | a nudge towards the middle | pulls the range away from the observed rate when clicks are few, and fades as they pile up |
None of this is mine. Edwin Wilson published this answer in 1927, about survey answers and coin tosses, decades before anyone had a search terms report [1]. A click that either converts or does not is the same shape of thing.
The clicks a fair chance costs. Set x = 0 and the formula collapses. With no conversions at all, the top of the range is simply z²⁄(n + z²). Ask when that drops below your benchmark p and you get
At 95% confidence and a 4% benchmark that is 93 clicks. At a 1% benchmark it is 381. The lower your ordinary conversion rate, the longer every term has to wait, which runs against the instinct that low-converting accounts can least afford to.
How sure is the 93 itself? Once you fix p and z it is exact arithmetic, so its only uncertainty is borrowed from your benchmark. This shop’s 4% rests on 400 sales in 10,000 clicks, which puts the benchmark between 3.6% and 4.4%, and so the click count runs from 84 to 102. You are as sure of the click count as you are of your benchmark, and no surer.
There is a back-of-the-envelope version, the rule of three: with no conversions in n clicks, the top of the range is about 3⁄n, which puts the 4% crossing at 75 clicks. It is the dotted line in the chart above.
Why not the interval from school? The one most people were taught is the observed rate plus or minus two standard errors. At zero conversions it gives a range of zero width, a claim that the term's true rate is exactly 0% with certainty. That is nonsense, and it is the very case you most want to judge. Agresti and Coull showed that the textbook version, which they call the Wald interval, performs badly unless the sample is large [3]. Brown, Cai and DasGupta compared the alternatives and concluded: "we recommend the Wilson interval or the equal-tailed Jeffreys prior interval for small n" [2].
A worked example synthetic data
Picture a running-shoe shop buying search ads only (synthetic, built so the right answer is known in advance). The same report exists on Google, Microsoft and any other search engine. The notebook that comes with this post builds the shop under one fixed seed, so every number here regenerates exactly.
In one month, 600 new search terms appear, take 6,631 euros of clicks, and produce 217 conversions. Behind the scenes, visible to me and not to the advertiser, 256 of those terms are simply irrelevant and 83 are on topic but not shopping. Together they take 57% of the month's spend.
Where the 4% benchmark comes from. It is an input the shop brings: the rate its established keywords convert at, 400 sales in 10,000 clicks. It is not the rate of the 600 new terms. Those convert at 2.7% between them, dragged down by the junk among them, and judging a term against a rate its own junk lowered would be circular. Take your benchmark from the keywords you already trust.
The four kinds of term. Each one carries a hidden true conversion rate the shop cannot see.
| irrelevant | on topic, not shopping | ordinary buyer | buying intent | |
|---|---|---|---|---|
| what it is | a stray word matched it | a question, not a purchase | converts near the benchmark | ready to buy |
| example | “shoe rack” | “how to clean running shoes” | “best running shoes” | “buy running shoes size 9” |
| true rate, hidden | 0.0% to 0.4% | 0.5% to 1.5% | 3.0% to 5.0% | 6.0% to 10.0% |
| share of the 600 | 43% | 14% | 23% | 21% |
| of the month’s 217 sales | 6 | 11 | 56 | 144 |
That bottom row keeps the rest honest. Irrelevant is not never. The band runs up to 0.4%, four sales in a thousand clicks, and this month those terms produced six. Step one blocks all 256 of them on day one, and those six sales go with them.
Are these numbers plausible? Site-wide fashion ecommerce converted at 1.81% in July 2026 [6], and apparel paid-search clicks at 4.50% in WordStream’s 2026 sample [7], so the shop sits inside published ranges. The 6 to 10% band for the best terms is not a market claim, only the usual pattern that high-intent terms beat an account's average.
The clicks spread out the way real search terms do: the median term gets 6 clicks in the month, 90% get 30 or fewer, and a handful get hundreds.
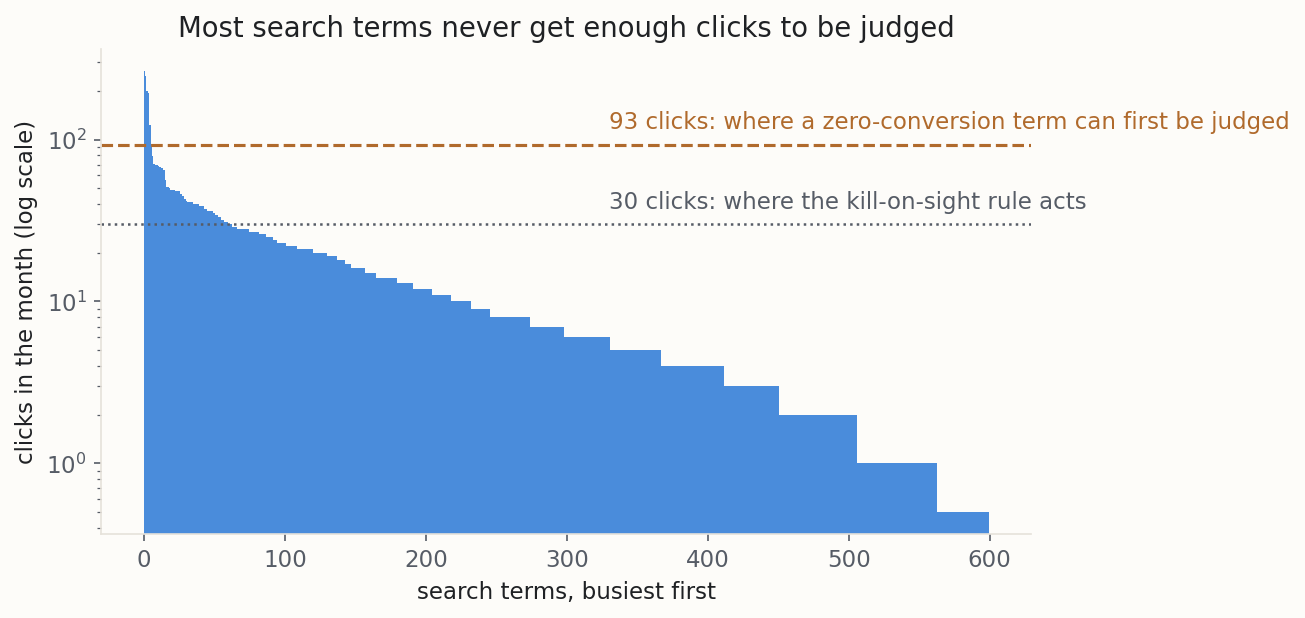
That chart is the whole problem. Almost every term a marketer blocks in a monthly review is blocked on data that cannot support the decision.
So the two steps split the work. Step one costs nothing and does most of it. Checking each term against a short list of what the shop sells blocks all 256 irrelevant terms at once, with no statistics involved. Step two protects what is left. Terms with enough clicks are judged against the 4% benchmark, and the rest keep running under an honest "not yet known".
Here is the month run three ways, over 28 days at €0.83 a click (spend over clicks), which works out at €30.56 per conversion if you block nothing.
| over one month | wasted spend | conversions kept | good terms blocked | conversions lost from good terms |
|---|---|---|---|---|
| Block nothing | €3,770 | 217 | 0 | 0 |
| Block on sight, 30 clicks | €3,273 | 208 | 5 | 5 |
| The two steps | €834 | 182 | 27 | 27 |
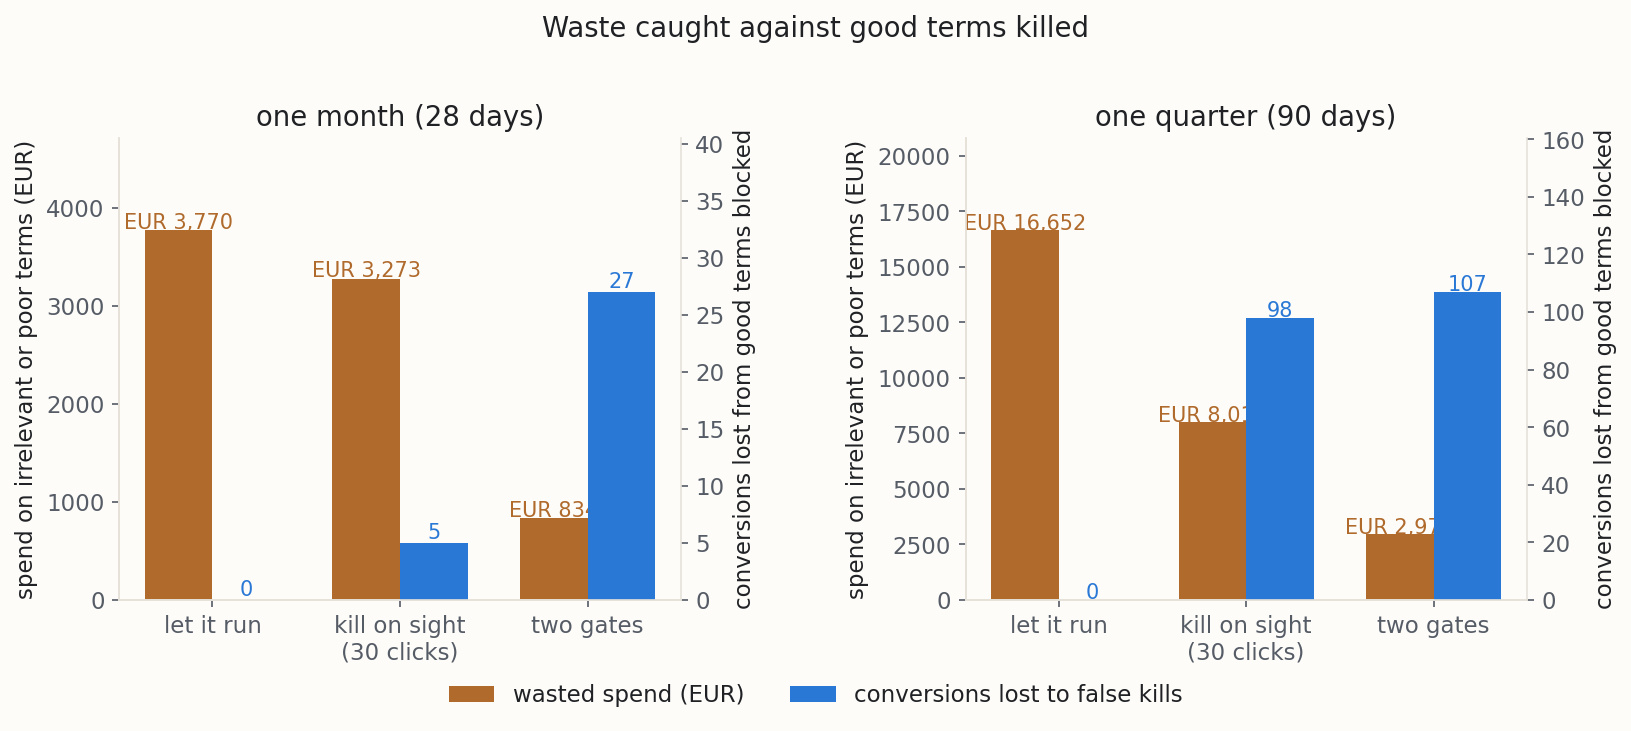
Follow the same terms for a quarter and the trade comes into focus. Over 90 days, block-on-sight leaves €8,016 of waste running against the two-step rule’s €2,974. The cost in good terms is nearly the same: 98 lost conversions against 107. Same damage, under two-fifths of the waste left behind.
Is any of it worth doing? That depends on what a conversion is worth to you, which the notebook cannot know. Counting all the spend each rule saves, block-on-sight breaks even at €62 a conversion over the month, and the two-step rule, run with the shop’s own word list, at €94. If a conversion is worth more than that, let the terms run.
But look at what you are paying for. Every good term the two-step rule killed was killed by step one’s word list. The interval killed none of them (27 by the list, against 27 in total). Add the missing words and the same rule kills 0 good terms, leaves €872 of waste and breaks even at €483 a conversion. The method was never the expensive part. An incomplete list was, and a list costs nothing to fix.
Even that version is not free: it still costs 6 sales over the month, from irrelevant terms blocked on day one, because “almost never converts” is not “never converts”.
The same trade in shop money. A block keeps saving its term's spend and keeps losing its term's sales, at the same pace, for as long as it stands, so weigh one quarter against one quarter. Say a pair of shoes sells for €50. Whether a lost sale costs you more than the spend saved depends on your margin, so the last column is the number to hold against what a conversion is worth to you.
| over the quarter | spend saved | sales lost, at €50 a sale | breaks even at |
|---|---|---|---|
| Block on sight, 30 clicks | €9,909 | €6,850 | €72 a conversion |
| The two steps | €15,042 | €7,550 | €100 a conversion |
| The two steps, with the 3 missing words added | €13,529 | €2,100 | €322 a conversion |
Every quarter the blocks stand, the two steps save more than block-on-sight and lose only a little more. The complete list is what changes the trade: it keeps nearly all the saving and loses less than a third of the sales. The gap between the last two rows is three words in a text file: "sneakers", "trainers" and "jogging". The busiest casualty of their absence was carbon plate trainers for running, with 247 clicks, 18 sales and €206 of spend in the month, blocked on day one and never measured.
How sure should you be?
The confidence level is a dial, not a law. Turn it down and terms are judged sooner, on less evidence.
On this campaign the dial buys very little. Dropping from 95% to 80% cuts the clicks a term needs by 53 and saves €61 of waste across the month, for 2 more good terms blocked and 1 more conversion lost. The trade is small because step one does most of the work. With a weaker relevance list, the dial matters much more. Reddit, for what it is worth, runs this interval at 80% to sort its comments [4].
| confidence | clicks a zero-conversion term needs | wasted spend | good terms blocked |
|---|---|---|---|
| 80% | 40 | €773 | 29 |
| 90% | 65 | €810 | 27 |
| 95% | 93 | €834 | 27 |
Try it on a term
Caveats to watch out for in this method
This method earns a stronger claim than blocking on sight. It does not earn certainty, and here is where it stops.
Everything step one blocks is blocked without evidence and without appeal. A relevant term phrased with a word your list lacks is simply gone. In the worked example the list cost 27 good terms for three missing words (11 for "sneakers", 8 for "trainers" and 8 for "jogging"), and the busiest casualty was pulling 247 clicks and 18 sales a month. Read the blocked-on-sight list before you apply it, every time, and treat anything surprising in it as a gap in your list.
A research-stage search may never convert on the click and still start journeys your brand keywords finish. Nothing in the data tells those terms apart from genuinely poor ones. If you know which they are, set them aside by name.
If your conversions arrive days after the click, the newest terms are judged on clicks whose conversions have not landed yet, which drags them down. End the report at least as long before today as your conversions take to arrive. A week or two is enough only if nearly all of them land within days. With a 30- or 90-day conversion window, wait that window. My platform waits until a campaign’s conversions are 95% in, or 94 days when it cannot tell.
A promotion, a tracking break or a new landing page part-way through the window means the terms were judged against a blend of two different rates, and terms near the line were judged wrongly in both directions. Start the report after the last thing that changed.
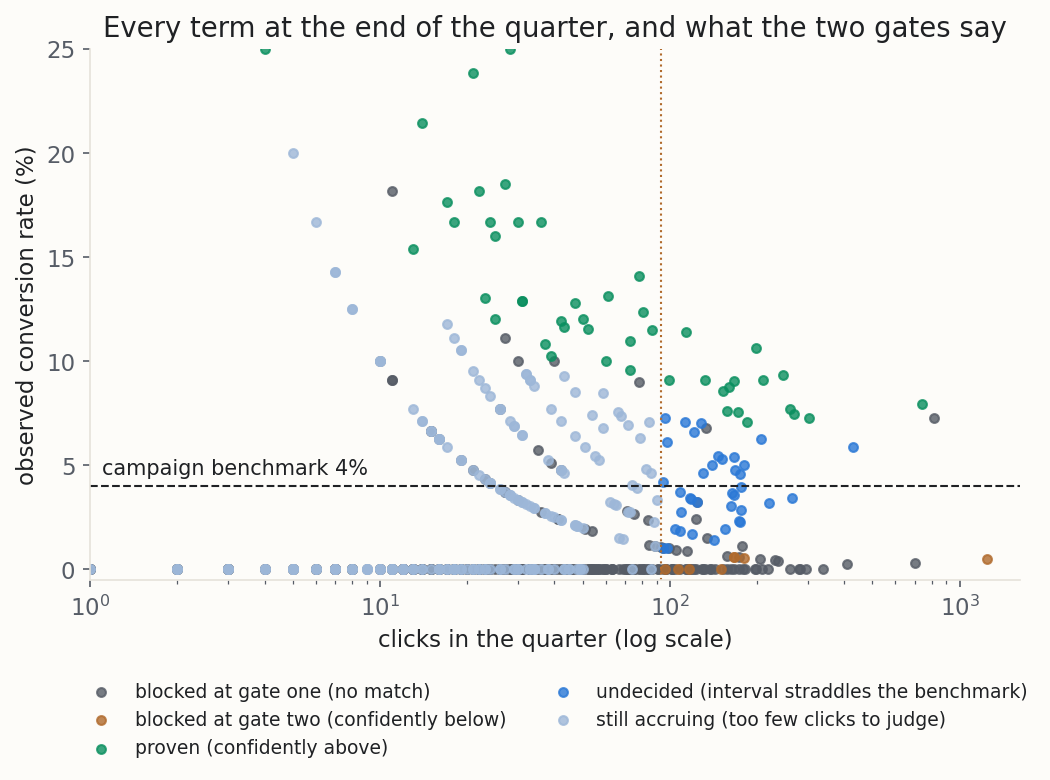
In the worked example, at the end of the month, 283 of the 600 terms sat in that state, against 23 judged good and a single one judged bad on performance. Such a term keeps running because it has not had a fair chance, not because it earned one. Reading that as "fine" is how spend piles up on terms nobody ever decided about.
Search engines only show you terms that clear a volume threshold. Google reports only on "terms that have seen sufficient search volume across all Google searches" [9]. The terms it withholds are low-volume by definition, far below any click count that could be judged. What that costs is reach. You cannot add a negative keyword for a term you were never shown.
Google says broad match can also weigh your landing pages, the searcher’s recent searches and your other keywords [8]. If that is doing real work, some of what your list rejects was shown to people the engine had reason to think would buy, and a word list cannot see that reason. That is one more reason to read the list before you apply it.
The confidence level is a chance per term, not a share of the terms you block. A term whose true rate is exactly your benchmark shows nothing across its first 93 clicks about one time in 45, and is blocked for it. A term clearly better than your benchmark almost never is: about 1 in 300 at 6%, and 1 in 2,300 at 8%. But the rule is read again on a growing total, and checked after every click (the worst case), a term sitting exactly at your benchmark is blocked about one time in 22 by 200 clicks and one in 8 by 1,000. Real weeks wobble more than coin tosses, which raises it further. That is why my platform confirms each block with a test built to be read every night. No setting makes you never wrong, so know how often you are for the way you actually read it. The same honesty applies to measuring a change you have already made.
Who actually uses this
Two public cases, and only two, because I keep to what can be sourced.
Reddit sorts comments with it. Its open-source code holds a function its authors named the confidence sort, which computes exactly the lower end of the interval above. It runs at 80% confidence, a constant sitting in the code as z = 1.281551565545 [4]. A comment with one upvote and nothing else should not outrank a comment with forty, and the raw rate cannot say so. The lower end of the range can.
Stack Overflow looked at the same method and turned it down. Jeff Atwood wrote it up in 2009, granted it was a clear improvement for Reddit, and concluded: "I am not sure it's as clearly useful for Stack Overflow" [5]. That is the honest shape of a method's adoption: fitted to one problem, declined for a neighbouring one, by people who understood it.
Run it on your own data
Every download runs entirely on your own computer, and your data never leaves it. They take one search terms report, exported as CSV, plus a short list of what you sell.
| column | meaning | example |
|---|---|---|
Search term | the query someone actually typed | buy running shoes near me |
Clicks | clicks the term received | 60 |
Conversions | conversions it produced | 9 |
Impr., Cost (optional) | context on the page, not part of the verdict | 1400, 50.40 |
Column names are matched loosely, so "Query" is read as the search term and "Conv." as conversions. If your report repeats a term across campaigns, ad groups or days, the notebook adds it up. Google's export opens with two title lines and ends with "Total" rows. The notebook skips both, so export it and leave it alone. It also refuses to give a confident answer it cannot support. With too few terms it says the benchmark is a guess, with zero conversions in the file it says step two cannot run at all, and with a list so broad that every term matches it tells you step one is doing nothing.
Getting your data out of the platform
Pull the whole life of each term. Clicks pile up, and a monthly review reads a running total rather than starting again each month. Export as far back as the terms have existed, not one billing period. At this shop’s pace the median term needs about 14 months to reach 93 clicks, which is why “not enough data yet” is the usual state.
In Google Ads, pick the campaign, then Insights and reports, then Search terms, with Impressions, Clicks, Cost and Conversions among the columns, over at least the last 90 days. In Microsoft Advertising, go to Reports, then the search terms report. The notebook also carries the query for the Google Ads API.
Two things people get wrong. Export the conversion column your campaign is actually optimised for, not "all conversions", because view-through and secondary actions make dead terms look alive. And keep it to one campaign, or the benchmark blends campaigns that convert at different rates.
You also need a list of what you sell, in the words a customer would type, not your internal product names. Two or three phrases of several words are enough to start. Single common words match everything and switch step one off entirely, which the notebook warns you about.
This part touches a spreadsheet or a light script, but you do not have to do it alone. Download the give-it-to-your-AI brief and hand it to ChatGPT, Claude, or any capable assistant. It carries everything the assistant needs to pull your report, shape it, and run the notebook, one step at a time, even if you have never written a line of code.
Common questions
How many clicks before I can block a term with no conversions?
What about a term that has conversions, but fewer than my benchmark?
Do I really have to wait 93 clicks on an obviously irrelevant term?
My account converts at 1%. Is this method useless for me?
Can I just lower the confidence to 80% and block faster?
Does this replace my own judgement about a term?
Try it on your own report
Export your search terms report for one campaign, over the whole life of its terms. Write three phrases that describe what you sell, block whatever matches none of them, and read that list once before it goes live. For everything left, find your benchmark's click count in the first of the common questions above and leave alone every term short of it. Next review day, when the red rows come back, you will know which ones have earned the click.
If you want a hand with the method, or with the paid media underneath it, I take on freelance work, and I answer questions about anything published here.
Get in touchReferences
- [1] Wilson, E. B. (1927). Probable inference, the law of succession, and statistical inference. Journal of the American Statistical Association, 22(158), 209 to 212, p. 209. Accessed 4 September 2026. https://www.jhanley.biostat.mcgill.ca/c607/ch08/wilson_jasa_1927.pdf
- [2] Brown, L. D., Cai, T. T. and DasGupta, A. (2001). Interval estimation for a binomial proportion. Statistical Science, 16(2), 101 to 133, p. 101. Accessed 4 September 2026. https://doi.org/10.1214/ss/1009213286
- [3] Agresti, A. and Coull, B. A. (1998). Approximate is better than "exact" for interval estimation of binomial proportions. The American Statistician, 52(2), 119 to 126, p. 119. Accessed 4 September 2026. https://doi.org/10.1080/00031305.1998.10480550
- [4] Reddit (n.d.). Source code, the file r2/r2/lib/db/_sorts.pyx, the confidence sort, running at 80% confidence. GitHub, reddit-archive/reddit. Accessed 4 September 2026. https://github.com/reddit-archive/reddit/blob/master/r2/r2/lib/db/_sorts.pyx
- [5] Atwood, J. (2009). Alternate sorting orders. The Stack Overflow Blog, 23 October 2009. Accessed 4 September 2026. https://stackoverflow.blog/2009/10/23/alternate-sorting-orders/
- [6] IRP Commerce (2026). Ecommerce market data, Fashion Clothing and Accessories, July 2026. Accessed 5 September 2026. https://www.irpcommerce.com/en/gb/ecommercemarketdata.aspx?Market=3
- [7] LocaliQ and WordStream (2026). Search advertising benchmarks for every industry, updated 1 June 2026, Apparel, Fashion and Jewelry row. Accessed 5 September 2026. https://localiq.com/blog/search-advertising-benchmarks/
- [8] Google Ads Help (2026). About keyword matching options. Accessed 5 September 2026. https://support.google.com/google-ads/answer/7478529
- [9] Google Ads Help (2026). Improving the search terms report while maintaining user privacy. Accessed 5 September 2026. https://support.google.com/google-ads/answer/11127882
From Stochastic Strata. I build marketing measurement that shows its working: every number carries its range, and when the data cannot answer a question, I say so and tell you what would. The worked example here is synthetic. The method is the real thing, and you can run it on your own data with the notebook or spreadsheet above. Nothing in this post is financial advice.