Attribution · 14 min read · Interactive
Which marketing channels actually drive sales — not just show up at the close?
Your customers see a display ad, search for you a week later, click an email, then type your URL and buy. Five touches, one sale. Which channel gets the credit?
The short answer
If you credit the sale to the last channel touched — the default in most ad platforms — you systematically under-credit the channels that start journeys and over-credit the ones that close them. The channel that closes looks profitable, the channel that opened the whole thing looks like a waste, and six months later you have defunded your own pipeline.
The data-driven fix is Markov chain attribution with the removal effect. You model journeys as a network of channel-to-channel steps, then ask, for each channel: if we deleted this channel from the network entirely, how much would total conversions fall? That drop — the removal effect — is the channel's credit. It rewards a channel for being structurally load-bearing, not for being in the right place at the end.
In the worked example below, last-click gives Display 9.8% of the credit; Markov gives it 17.2% — because removing Display starves the searches it feeds. The same model gives Email 0%, down from last-click's 11.6%, because Email's visitors could reach a sale through the other channels anyway.
One honest caution up front: the removal effect is a model of your journey data, not a controlled experiment. It is far better than last-click, and it has its own failure modes. The section caveats to watch out for is the important one.
The marketing question
Channel budgets get set from per-channel performance. So the question "how much did this channel contribute?" is not academic — it decides what gets funded next quarter.
Last-click answers it with one rule: the final touch before the sale gets 100% of the credit, everything earlier gets nothing. First-click, linear, position-based and time-decay all swap one fixed rule for another fixed rule. None of them measures a channel's contribution; they assume a shape and apply it.
The failure is specific. A channel that consistently moves people from awareness toward a purchase — a display ad that primes a later branded search, a podcast mention that ends in a direct visit — is almost never the last touch, so last-click records it as unproductive. Cut it, and the downstream channels quietly lose the warm traffic they were converting. The metrics never saw it coming, because they never recorded what the upstream channel was doing.
The idea, in plain words
Treat every customer journey as a walk through a small set of states:
- a START state every journey begins in,
- one state per channel (Display, Search, Email, …),
- a CONVERSION state (they bought) and a NULL state (they left without buying).
CONVERSION and NULL are absorbing: once a journey lands there, it is over. From your observed journeys you count how often customers move from each state to each other state, which gives a transition matrix — the probability of every next step.
Then, for each channel, you run the counterfactual: remove that channel, send the traffic that used to flow through it to wherever else those customers went, and recompute the overall chance of conversion. If it drops a lot, the channel was load-bearing. If it barely moves, the channel was replaceable.
The formula, term by term
Split the transition matrix into two blocks: Q, the channel-to-channel moves, and R, the moves that exit to CONVERSION or NULL. The core of the method is one piece of linear algebra, the Fundamental Matrix:
N = (I − Q)−1
- Q
- the sub-matrix of transitions between transient states (START and the channels).
- I
- the identity matrix, same size as Q.
- N
- the Fundamental Matrix. Entry N[i][j] is the expected number of times a journey starting at state i visits state j before it is absorbed. This is an exact result, not a simulation — no loop, no convergence threshold.
Multiply by R to get the absorption probabilities, and read off the baseline conversion rate:
B = N RPconv(full) = B[START, CONVERSION]
- B[i][j]
- the probability a journey starting at i ends in absorbing state j.
- Pconv(full)
- the chance a fresh journey (from START) eventually converts, under the full model.
Now remove a channel c. The traffic that used to flow into c is spread across the remaining destinations in proportion to their existing shares, the removal effect is the drop in the conversion rate on the smaller network, and the credits are those drops rescaled to 100%:
Tc[i][j] = T[i][j] / (1 − T[i][c])
R(c) = Pconv(full) − Pconv(c removed)
Credit(c) = R(c) / Σ R(c′) × 100
- 1 − T[i][c]
- what is left of state i's outbound traffic once c is gone; dividing by it rescales the surviving moves so the row still sums to one.
- R(c)
- the removal effect — the actual conversion-rate cost of losing the channel. This is the honest quantity; the credit percentage is a presentation convenience that puts channels on one scale.
A worked example synthetic data
The notebook generates 4,000 synthetic journeys across three channels, with a deliberately realistic flow: Display starts most journeys and mostly hands off to Search; Search is where the conversions happen; Email is a weaker feeder that mostly drops off. Of the 4,000 journeys, 32.0% convert, and the modelled baseline conversion probability from START is 0.320. The data is synthetic and labelled as such; the point is the method, not the numbers.
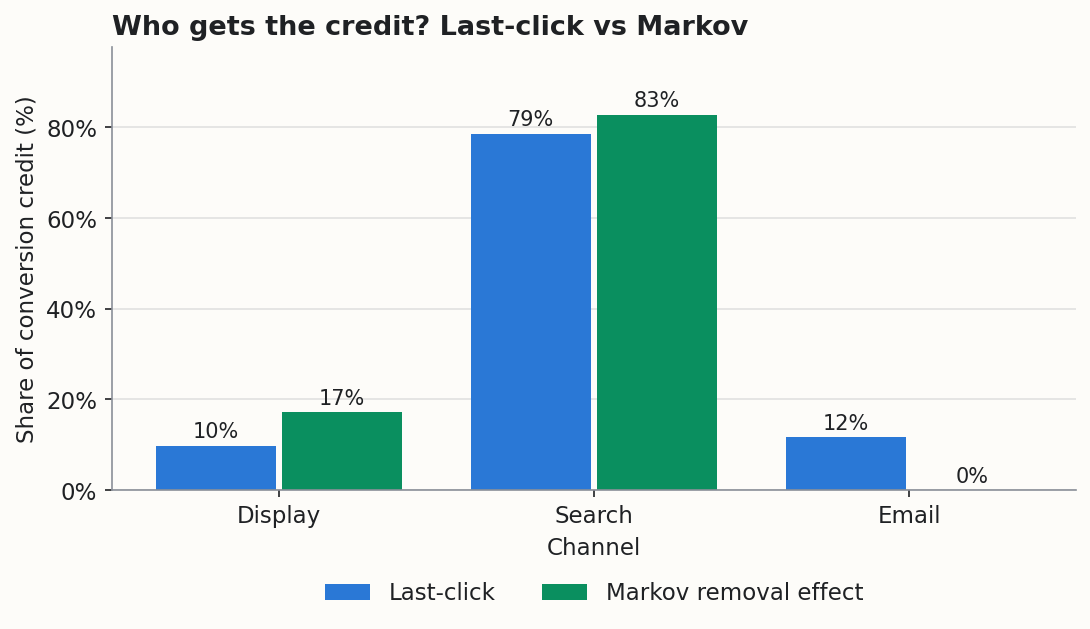
| Channel | Last-click | Markov | Removal effect R(c) |
|---|---|---|---|
| Display | 9.8% | 17.2% | 0.035 |
| Search | 78.6% | 82.8% | 0.168 |
| 11.6% | 0.0% | −0.053 → 0 |
Two things move. Display nearly doubles: last-click barely credits it because it is almost never the final touch, but pull it out of the network and the searches it feeds never happen. Email collapses to zero: last-click credits it for sitting near the close, but the model finds its visitors could still reach a sale through the other channels, so it is structurally substitutable here. Last-click was scoring position in the journey; the removal effect scores whether the channel is load-bearing.
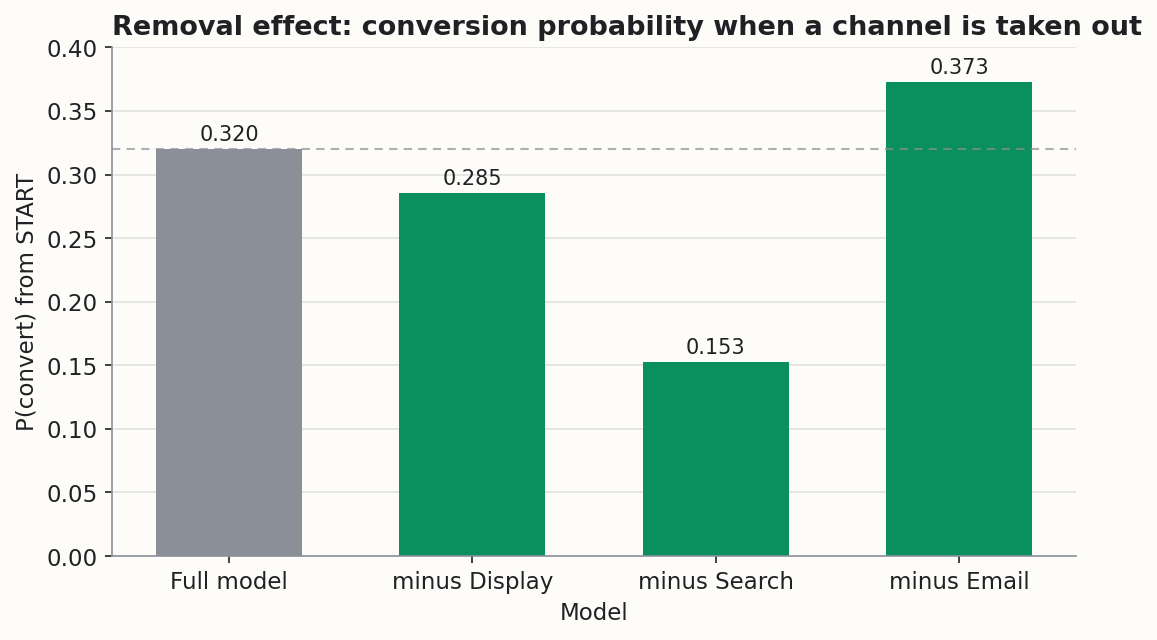
Removing Search drops the conversion rate hardest — it is the closer. Removing Display drops it a little — the upper-funnel contribution last-click missed. And removing Email actually raises the modelled conversion rate, because Email's traffic reroutes onto channels that convert better. That is a negative removal effect, and it is clipped to zero: a channel cannot earn negative credit.
Move the journey yourself
Caveats to watch out for in this method
Every method has failure modes. Naming them is not a disclaimer; it is how you avoid making a bad call from a good-looking number.
The removal effect measures structural importance in your journey graph — how the pieces connect — not proven cause and effect. Large advertising experiments have found that observational attribution can disagree with the answer a randomised test gives on the same advertiser’s data, sometimes enough to flip the recommendation. If a number is about to move real budget, back it with an experiment — a geo holdout, an incrementality test — not attribution alone.
Branded search and direct traffic sit at the end of almost every journey, and the removal-effect maths systematically over-credits them — pull out the channel everyone passes through on the way to buying and of course conversions collapse, even if its marginal contribution was small. In the worked example Search takes 82.8%. Read a dominant lower-funnel share with suspicion, not satisfaction.
Email scored zero because its visitors were substitutable — they could convert through the other channels. Change the mix, so that Email is the only way some customers ever arrive, and its removal effect turns strongly positive. Zero credit is a statement about this network, not a verdict on the channel.
The model assumes your next step depends only on where you are now, not on the full history — a cold search and a search that a display ad primed are treated as the same state. Real journeys have memory. Higher-order models can capture the sequence, but they overfit on the sparse journey data most mid-market advertisers have, so first-order is the standard compromise, not a free lunch.
The method attributes the journeys it can see. Cookie loss, cross-device gaps, consent denial and "dark social" all fragment or hide journeys. If a large share of your journeys are broken into short visible fragments, credit drifts toward whatever channel is still visible at the close. Watch your single-touch rate: if most journeys have exactly one touch, you are probably measuring broken tracking, not real single-touch behaviour.
The transition matrix is estimated over a window, and it assumes customer behaviour is roughly stable across it. A new campaign, a seasonal shift or an audience that changes mid-window blends two different worlds into one average.
What we added: credit as a range, not one convention
The removal effect has a choice hidden inside it, and most tools make it silently. When you delete a channel, where does its traffic go? The formula above sends it all to the other channels — it assumes the customer who would have arrived through the deleted channel finds another way to buy. That single assumption is why Email scored 0%: the model treated its visitors as fully substitutable. The older convention assumes the opposite — the deleted channel's customers are lost, and never convert [ANDERL-2016].
Neither is right for every channel, and which one is closer depends on the channel. Pull out one of several interchangeable awareness channels and its traffic reroutes — full substitution fits. Pull out a channel that some customers use as their only way in, and those customers are gone — the loss convention fits. Picking one convention for the whole account hides that difference behind a modelling choice.
So instead of picking one, we compute both. We added one dial — a substitution rate s — to the removal step: at s = 1 the freed traffic reroutes (the standard removal effect above), at s = 0 it is lost. For each channel we then take two readings — its credit if its traffic substitutes, and its credit if that channel's customers are the ones with nowhere else to go — and report the range between:
| Channel | If it substitutes | If its customers are lost | Range |
|---|---|---|---|
| Display | 17.2% | 53.2% | 17–53% |
| Search | 82.8% | 88.0% | 83–88% |
| 0.0% | 30.4% | 0–30% |
The middle column asks a different question in each row — what is this one channel worth if its customers, and only its customers, had no other route to a sale? That is why it does not add to 100%: it is a per-channel worst case, not a single scenario. The low end of each range is the substitutable reading; a channel is worth at least that, and more if its customers are lost.
Read Email's row. Its credit is not 0% — that was the substitutable reading. If Email's visitors had no other way to a sale, removing it costs conversions and its credit climbs to 30%. Its range is 0% to 30%, and where it lands turns on how substitutable those visitors are in your mix. Search moves little either way — 83% to 88% — so its credit does not turn on this assumption at all. The width of the band carries that: a wide band means the number depends on an assumption you have not tested; a narrow one means it does not.
We also order the channels by how substitutable each one looks, read from its own journey structure — a channel whose visitors mostly move on to other channels is substitutable; one whose visitors keep returning to it is not. That places each channel within its band. This structural read is ours: we built it and tested it against simulated journeys with a known answer. Turning a band into a single point per channel — the exact substitution rate — needs data on what happens when a channel goes quiet, a different kind of evidence, and the subject of the next section.
From correlation to cause: why you triangulate
Everything so far — last-click, the removal effect, the band — reads the journeys you already have. It can tell you which channels are structurally load-bearing, but structural importance in observed data is not the same as causing extra sales. A channel can sit on every winning path and still be riding along rather than driving. Large advertising experiments have found that observational attribution and a randomised test on the same advertiser's data can disagree, sometimes enough to flip the recommendation [GORDON-2019].
The only way to know whether a channel causes sales is to change it and watch. That is what an experiment does. A geo holdout turns a channel off in some regions and leaves it on in others, then compares — the channel causes the difference, because nothing else differed by region on purpose. Google and Meta will also run this for you at the user level — a held-out group sees no ads, and the gap in conversions is the lift the channel caused — though only for spend on their own platform.
Neither replaces attribution — they answer different questions, at different costs. Attribution is cheap and runs on data you already have, so it is the right tool to narrow the field: to find the two or three channels whose credit is surprising and worth the price of a test. An experiment is slow and expensive, so you spend it on those few. Triangulation is running more than one independent method and seeing where they land. When the removal effect, a media-mix model and a holdout test all point the same way on a channel, you can move budget on it. When they disagree, that disagreement is the signal — it names the channel to test next, not the method to trust blindly. No single number here is the truth; the confidence comes from independent methods agreeing, and from stating the range when they do not.
How the industry uses it
The removal-effect approach comes from the marketing-science literature — Anderl and colleagues introduced the graph/Markov-walk framework and applied it to four large real advertiser data sets, comparing first- and higher-order models [ANDERL-2016]. The most widely used open-source implementation is the R package ChannelAttribution, described on CRAN as "a probabilistic algorithm for the attribution problem" that "uses a k-order Markov representation to identify structural correlations in the customer journey data" [CHANNELATTRIBUTION-CRAN]. Commercial vendors build on the same idea — Windsor.ai, for instance, offers "easy-to-read Markov models" as an attribution product [WINDSOR-AI].
One point worth getting right, because it is easy to assume otherwise: Google's "data-driven attribution" is not a Markov model. Google Analytics 4 describes it as using "machine learning algorithms" and "a counterfactual approach" [GA4-DDA], and Google's own methodology page names the mechanism outright — it "computes the counterfactual gains of each marketing touchpoint" using "the Shapley Value," from cooperative game theory [GOOGLE-MCF-DDA]. Neither page mentions Markov chains at all. Shapley and the Markov removal effect are cousins — both ask "what happens if this touchpoint were not here?" — which is exactly why they get confused, but the algorithms are different. If you are comparing your own Markov result to Google's number, you are comparing two different methods, not checking one against itself.
Run it on your own data
Both downloads run entirely on your machine — your data never leaves it. They take a table of conversion paths, the same format the open-source tools accept:
| column | meaning | example |
|---|---|---|
path | channels in order, separated by > | Display > Search > Email |
conversions | journeys that followed this path and converted | 120 |
non_conversions | journeys that followed it and did not | 380 |
Both warn you in plain words when the data is too thin to trust instead of printing a confident number they cannot support. As rough rules of thumb they flag fewer than ~300 converting journeys, any channel appearing in fewer than ~30 journeys, and a single-touch rate above ~60% (a sign of broken journey stitching).
Getting your data into that shape
Almost nobody already has a paths table. What you can export is a raw touch log: one row per touch — who, when, which channel, and whether they bought. So the notebook now includes a consolidate_touchpoints helper that does the tedious middle step: it groups each person's touches into sessions, orders them, starts a fresh journey after each purchase, collapses repeats, and returns the paths table the loader wants. A synthetic touch log run through it reproduces the exact credit above, so the plumbing is verified.
What the helper cannot do is fetch the touches. No ad platform will give you the cross-channel sequence — Google Ads sees only Google touches, Meta only Meta. The joined-up journey lives in your analytics: for most people, Google Analytics 4's free, event-level BigQuery export, since the GA4 interface only shows aggregated path reports. The notebook ships a ready BigQuery query that turns that export into the touch log — one row per session — with the caveats stated plainly:user_pseudo_id is one browser on one device, consent-modelled conversions never reach BigQuery, and a GA4-only model under-credits impression-heavy paid social. Assembling and stitching that data is the part the platform automates; here we show how to do it by hand.
This part is technical — a database query and a notebook — but you do not have to do it alone. Download the give-it-to-your-AI brief and hand it to ChatGPT, Claude, or any capable assistant. It carries everything the assistant needs to walk you through getting your data and running the analysis, one step at a time, even if you have never written a line of code.
Common questions
Is this the same as Google Analytics' data-driven attribution?
Does a high Markov score mean the channel caused those sales?
How much data do I need?
Why did one of my channels get 0%, or a negative removal effect?
Does the order of touches matter?
Can I use this to set budgets directly?
Running this on your own account
The worked example above is synthetic; the notebook runs on your data instead, and every number it gives you carries its range. If you want a hand with the method — or with the paid media underneath it — I take on freelance work, and I answer questions about anything published here.
Get in touchReferences
- [GRINSTEAD-SNELL] Grinstead, C. M. & Snell, J. L. Introduction to Probability, Ch. 11: Absorbing Markov Chains. American Mathematical Society. https://math.dartmouth.edu/~prob/prob/prob.pdf
- [ANDERL-2016] Anderl, E., Becker, I., von Wangenheim, F. & Schumann, J. H. (2016). Mapping the customer journey: Lessons learned from graph-based online attribution modeling. International Journal of Research in Marketing 33(3), 457–474. https://ideas.repec.org/a/eee/ijrema/v33y2016i3p457-474.html
- [CHANNELATTRIBUTION-CRAN] Altomare, D. & Loris, D. ChannelAttribution: Markov Model for Online Multi-Channel Attribution. CRAN. https://cran.r-project.org/package=ChannelAttribution
- [GOOGLE-MCF-DDA] Google. MCF Data-Driven Attribution methodology. Analytics Help (accessed 2026-07-16). https://support.google.com/analytics/answer/3191594
- [GA4-DDA] Google. Data-driven attribution in Google Analytics 4. Analytics Help (accessed 2026-07-16). https://support.google.com/analytics/answer/10596866
- [GORDON-2019] Gordon, B. R., Zettelmeyer, F., Bhargava, N. & Chapsky, D. (2019). A comparison of approaches to advertising measurement: Evidence from big field experiments at Facebook. Marketing Science 38(2), 193–225. https://doi.org/10.1287/mksc.2018.1135
- [WINDSOR-AI] Windsor.ai. Shapley value vs Markov model in marketing attribution (accessed 2026-07-16). https://windsor.ai/shapley-value-vs-markov-model-in-marketing-attribution/
From Stochastic Strata. We build marketing measurement that shows its working: every number carries its range, and when the data cannot answer a question, we say so — and tell you what would. The worked example here is synthetic; the method is the real thing, and you can run it on your own data with the notebook or spreadsheet above. Nothing in this post is financial advice.